Download

1 / 53
540 likes | 779 Vues
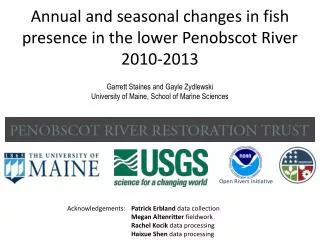
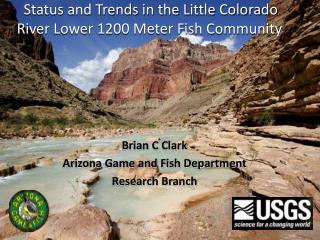
Fish passage in the lower Penobscot River. Photo pursuant to NMFS permit # 1595. Gayle Zydlewski Matthew Wegener Patrick Erbland. Penobscot River Restoration Trust.

E N D
Fish passage in the lower Penobscot River Photo pursuant to NMFS permit # 1595 Gayle Zydlewski Matthew Wegener Patrick Erbland Penobscot River Restoration Trust This project is ongoing and is currently funded by the Penobscot River Restoration Trust and made possible by the NOAA Restoration Center and the American Recovery and Reinvestment Act.
Presentation Outline • Sturgeon • 2010 • Methods, Results, Challenges • 2011proposed improvements • Questions • Hydroacoustics • 2010 • Methods, Results, Challenges • 2011proposed improvements • Method for integrating across projects • Questions
Sturgeon • Proposed project outcomes • Determine whether SNS spawnin the Penobscot River and characterize spawning habitats. • Model habitat suitability between the Sedgeunkedunk Stream and Milford dam. • Timeline • Fall 2009 late stage females captured tagged and released. • Winter monitoring. • Spring 2010 and 2011, telemetry array • initiate monitoring for adult SNS movement to spawning habitats. • New habitat data as available throughout the study period. • Spring 2010 and 2011 • Movements • Netting for eggs/larvae • Tagging in fall 2011 • habitat assessments and modeling.
Penobscot Sturgeon • Historically robust population • Declined due to • Overfishing • Dams • Pollution
Penobscot Sturgeon • 1978 – One SNS captured by DMR • 2005 – Angler reports catching SNS • 2006 – Steve Fernandes – 63 SNS • 2008-2010 – Phill Dionne • Seasonal Pop. Estimates • 636 - 1285
Penobscot Sturgeon • Dam Removals • Veazie & Great Works • Restore access to all historic sturgeon habitat • Response of sturgeon? • Kennebec’s Edwards Dam • Removed in 1999 • Lack of studies, but fish populations appear to have increased
Current Sturgeon Objectives • Model suitable spawning habitat • Document spawning in Penobscot • Collection of eggs and/or larvae • Explain observed spring movements between river systems • Acoustic telemetry
Modeling Objective • Develop River2D model of spring conditions within Penobscot • Predict sturgeon spawning habitat • Below Veazie • Above Veazie
Modeling • Habitat Suitability Index (HSI) curves • Represent environmental variables organisms respond to • Completely suitable = 1 • Completely un-suitable = 0
Original Model Combined suitability flow = 300 cms Original HSI curves
Modified Model • Adjustments • Flow = 600 cms • Modified HSI curves • Tidal stage = high tide Predicts much less Suitable habitat
Modified Model • Adjustments • Flow = 600 cms • Modified HSI curves • Tidal stage = low tide
Additional Model Changes • Run transient flow model for tidal reach • Collect bathymetry and build model between Veazie Dam and Great Works Dam • Incorporate substrate in the form of altered roughness values • Further modify HSI curves • Water velocity, depth, and substrate
2010 Field Methods • Spawning Methods • Actively track and set gear below fish • Other researchers successful • Acoustic Telemetry • Active and passive acoustic tracking • Sturgeon movement within river • Tagging • Summer 2010 • 12 Adult sturgeon internally implanted with acoustic tags • Fall 2010 • 18 Adult sturgeon internally implanted with acoustic tags
2010 Field Methods • Gear Types • Artificial Substrates • D-nets
2010 results • Spawning NOT documented • Sturgeon moved downstream with 1st high flow as water temperature increased • Timing dependant on year • 2010 very early!
Temperature and gage height from Spring 2010. The blue shaded area is the expected spawning window, based on Kynard (1997).
2010 Results • Spawning NOT documented • Sturgeon moved downstream with 1st high flow • Sampling • D-Nets fished for 394 net hours - 418 river herring eggs - Several hundred smelt eggs - 1 American eel elver (released alive) - 11 fish larvae (not shortnose sturgeon) • Artificial substrates fished for 2712 string hours - Nothing collected
SAMPLE AREAS Blue areas = D-Net Brown areas = Substrate 256 net hours – April 26 – June 25 30 net hours June 10 4 net hours – May 6 74 net hours – April 22 – May 18 672 substrate hours - April 8 – April 22 2040 substrate hours March16 – April 8 [Known overwintering area] 30 net hours April 8 – April 23
2010 challenges • Relatively small # of acoustically tagged fish • Slow acoustic tag ping rate • Hard to actively track and locate • Model not refined • Not able to model correct flow or incorporate tides • Uncooperative fish
Upcoming 2011 Field Season • Summer 2010 • 12 Adult SNS acoustically tagged • Oct. 8, 2010 • 18 Adult SNS acoustically tagged • 6 known late stage females • Tags programmed differently • Off over winter, fast ping in spring, slow ping summer • Potentially 38 acoustically tagged SNS in Penobscot • Larvae Sampling (D-nets) • Night sampling • Larvae active at night
Upcoming 2011 Field Season • Kennebec • Spring migrants from Penobscot • Where in Kennebec and Why? • Degree of work yet to be determined (Dec. 16) • Tracking vs. sampling
Presentation Outline • Sturgeon • 2010 • Methods, Results, Challenges • 2011proposed improvements • Questions • Hydroacoustics • 2010 • Methods, Results, Challenges • 2011proposed improvements • Method for integrating across projects • Questions
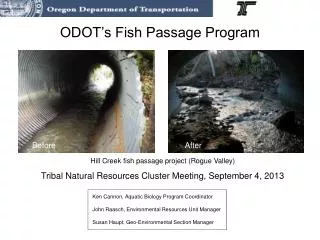
Fish passage – system wide Hydroacoustics • Objective: • Determine the abundance of diadromousfishes approaching the counting facilities at the lower dam. • Translation: Proposed Objectives: • Establish split beam hydroacoustics as a long-term assessment tool for determining numbers of upstream and downstream migrating diadromous fishes in the Lower Penobscot River. • Determine numbers of individual upstream and downstream moving targets and discriminate by species as possible. • Determine validation needs of hydroacoustic systems.
Hydroacoustics: • Proposed Project Outcomes: • A standardized, quantifiable assessment tool for migratory fish counts pre and post river restoration activities. • The impact of dam de-construction on the extent of fish presence in the lower river will be assessed. • Timeline • Fall 2009 potential areas for monitoring will be surveyed for bottom type and morphology; equipment will be purchased/leased within 90 days of a finalized contract. • Winter 2009/2010 permission and permits for mounting and powering gear will be acquired. • Spring 2010 hydroacoustic gear will be installed in the lower Penobscot River.
Fish passage – system wide Hydroacoustics • Objective: • Determine the abundance of diadromousfishes approaching the counting facilities at the lower dam. • Translation: Proposed Objectives: • Establish split beam hydroacoustics as a long-term assessment tool for determining numbers of upstream and downstream migrating diadromous fishes in the Lower Penobscot River. • Determine numbers of individual upstream and downstream moving targets and discriminate by species as possible. • Determine validation needs of hydroacoustic systems.
Fish passage – system wide Hydroacoustics • Objective • Determine the abundance of diadromousfishes approaching the counting facilities at the lower dam. • Proposed Outcomes • A standardized, quantifiable assessment tool for migratory fish counts pre and post river restoration activities. • The impact of dam de-construction on the extent of fish presence in the lower river will be assessed.
Project Objectives • Establish split-beam hydroacoustics as a long-term assessment tool for migrating diadromous fishes in the Lower Penobscot River. • Determine numbers of individual upstream and downstream moving targets and discriminate by species as possible. • Determine validation needs of hydroacoustic systems.
Single Beam Sonar Send Receive • Target Strength and Range • Size
Split-beam Sonar Angular (x/y) position off central axis • Speed and 3D trajectory
Split-beam Sonar Angular (x/y) position off central axis • Speed and 3D trajectory
Multibeam Sonar (DIDSON) • Multibeam (DIDSON) • “Fish TV” • Behavior / identification • Limited range • No Vertical Resolution (X but no Y)
Objective 1 • Initial Bathymetric Surveys • Power Source/ Security • Landowner Approval/ Assistance • Cianbro/ Waterfront Marine • Fine Scale Position and Orientation
Objective 1 Spring Training
Objective 1 Design and Installation
Secondary Study - Shad WATERFALL Downstream
Secondary Study - Shad American shad response to Hydroacoustics Frequency Click Response Index 420 200 120 Low High
Objective 2 Both systems recording April 28 – Nov 4 almost 4TB data (x2 archive) system down time/ data gaps
Objective 2 Analysis Software Echoview –customizable, user friendly post processing define parameters for taxonomic groups
Objective 2 Analysis Software Biosonics Fish Tracer - automated real-time program Fish trace characteristics for taxonomic partitioning
Objective 2 Mean Length (cm) Hundreds of Fish / Gauge Height (cm) Date
Objective 2 Fish Count /100 - Tidal Height (ft) Mean Length (cm) Date / Time
Objective 2 Validation- Error in counts from split-beam Type I & II – flow, wind, rain, boat traffic, etc. DIDSON/ Echoview Extrapolation- Split-beam count vs. entire cross section Spatial distribution of fish passing site DIDSON Classification- apportion counts taxonomically Species composition , variation w/ time Directly- Gill Net, Fishwheel, DIDSON, (E-Fishing?) Indirectly- Fishway count, NOAA survey, Acoustic Telemetry, upstream eggs and larvae Anatomy and Behavior- Echoview
Challenges/considerations • Tidal Influence • Weighs heavily on analysis • Need an ADCP • Transducer Frequency • 200kHz, low power • Further research w/ shad • Electrofishing- limited sampling depth • Transducer Geometry
Transducer Geometry 6 Degree Conical Beam 4 x 8 Degree Elliptical Beam High Tide Low Tide
For Next Year Analysis of 2010 Data is ongoing DIDSON Surveys First years data to help target sampling times and improve techniques Networking Field Computers Real-time observation of fish passage Reduced system down time/ data gaps Additional work with American shad