Routing in packet switching networks
590 likes | 1.3k Vues
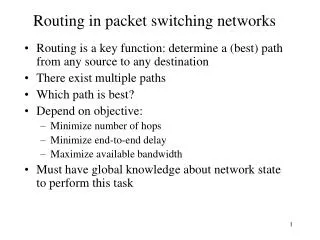
Routing in packet switching networks. Routing is a key function: determine a (best) path from any source to any destination There exist multiple paths Which path is best? Depend on objective: Minimize number of hops Minimize end-to-end delay Maximize available bandwidth

Routing in packet switching networks
E N D
Presentation Transcript
Routing in packet switching networks • Routing is a key function: determine a (best) path from any source to any destination • There exist multiple paths • Which path is best? • Depend on objective: • Minimize number of hops • Minimize end-to-end delay • Maximize available bandwidth • Must have global knowledge about network state to perform this task
An example of a packet-switch network 1 3 6 A 4 B Host 2 Switch or router 5 Paths: 1-3-6, 1-4-3-6, 1-2-5-6, … Figure 7.23
Criteria for a good routing algorithm • Correctness: correct route and accurate delivery of packets • robustness: adaptive to changes of network topology and varying traffic load • Cleverness: ability to detour congestion links and determine the connectivity of the network. • Efficiency: rapid finding of the route and minimization of control messages.
Classification of routing algorithms • Static vs. dynamic: • Static: manually compute routes, simple, but not scalable and dynamic • Dynamic: automatic route computation, adaptive to dynamics of network but complicated • Centralized vs. distributed • Centralized: a center entity computes all routes and load the routes into all routers, but not scalable • Distributed: routers exchange topology information and perform own computation of routes, but inconsistent and loop routes. • In datagram, routing is based on packet by packet but in VC, routing is executed during setup
Routing tables • Store routing information, being looked up to forward packets • Different networks have different routing tables • Datagram: destination address + next hop • VC: incoming VCI + out-going VCI + out-going port #
Virtual-circuit packet switching Three connections: 1. Solid line: A 1 3 6 B with local VCIs 1,2,7,8 2. Dotted line: A …1…3…4 …5… D with local VCIs 5,3,4,5,2 3. Dashed line: C --- 2--- 4--- 3--- 6 B with local VCIs 6,3,2,1,5 2 7 1 8 B 1 3 3 A 1 6 5 5 4 2 4 3 5 2 C 5 6 D 2 • Reasons using local VCIs rather than global VCIs: • searching for an available VCI is easier because of local uniqueness • More available local VCIs, so there can have more connections Link 1—3 is shared by connection 1 and 2 Link 3—4 is shared by connection 2 and 3 Therefore the connection is called virtual-circuit. Figure 7.24
Routing table for virtual-circuit packet switching network. Node 3 Incoming Outgoing Node 6 Node 1 node VC node VC 1 2 6 7 Incoming Outgoing Incoming Outgoing 1 3 4 4 node VC node VC node VC node VC 4 2 6 1 3 7 B 8 A 1 3 2 6 7 1 2 3 1 B 5 A 5 3 3 6 1 4 2 B 5 3 1 3 2 A 1 4 4 1 3 B 8 3 7 3 3 A 5 Node 4 Incoming Outgoing node VC node VC 2 3 3 2 Node 2 Node 5 3 4 5 5 Incoming Outgoing Incoming Outgoing 3 2 2 3 node VC node VC node VC node VC 5 5 3 4 C 6 4 3 4 5 D 2 4 3 C 6 D 2 4 5 Figure 7.25
An example of a datagram packet-switch network 1 3 6 A 4 B Host 2 Switch or router 5 Paths: 1-3-6, 1-4-3-6, 1-2-5-6, … Figure 7.23
Routing table for datagram packet switching network Node 3 Destination Next node Node 6 Node 1 Destination Next node 1 1 Destination Next node 2 4 1 3 2 2 4 4 2 5 3 3 5 6 3 3 4 4 6 6 4 3 5 2 5 5 6 3 Node 4 Destination Next node 1 1 2 2 Node 2 Node 5 3 3 Destination Next node Destination Next node 5 5 1 1 1 4 6 3 3 1 2 2 4 4 3 4 5 5 4 4 6 5 6 6 Figure 7.26
Hierarchical routing • Size of routing tables will become extremely large when network increases • Solution is: the hosts close to each other are assigned network addresses with the same prefixes. In a remote routing table, all these hosts are treated as one address, just one entry in the routing table. (only in the local routing table, these hosts are treated separately). • All packets towards to these hosts are forwarded to this area from remote area based on remote routing table and further forwards to the specific host based on local routing table. • Therefore hierarchical addressing.
Hierarchical routing table 0011 0110 1001 1100 0010 0101 1000 1111 0001 0100 1011 1110 0000 0111 1010 1101 0100 0101 0110 0111 1100 1101 1110 1111 1000 1001 1010 1011 0000 0001 0010 0011 R2 R2 R1 R1 (a) 1 4 3 5 2 00 1 01 3 10 2 11 3 00 3 01 4 10 3 11 5 (b) 1 4 3 5 2 0001 4 0100 4 1011 4 … … 0000 1 0111 1 1010 1 … … Figure 7.27
IP hierarchical addressing • IP address = Network ID + Host ID • Host ID = subnetwork ID + host ID • Moreover, supernetting (CIDR--Classless InterDomain Routing) is another type of hierarchical addressing in IP
How to compute routes dynamically • Best path is based on different metrics: hops, delay, available bandwidth, in general, call them cost. • The best path is one with minimum cost or shortest path. • The routing algorithm must be told which metric to use • The routers exchange (routing) information to obtain values of these metrics for different links. • Using one of two types of typical routing algorithms to compute the best route • Link state routing • Distance vector routing • Routing information exchange (and route computation) is the most important function behind networks even we do not feel it. Of course, this function should be efficient and not consume too much network bandwidth.
Distance vector routing • Every router maintains its distance vector (DV) which records distance to each of other hosts. • Every router exchanges DV with its neighborsperiodically. • Whenever a router receives a DV from its neighbor, it checks whether new better routes through this neighbor can be found, if yes, modifies its DV. • From its DV, a router can directly derive its routing table. • Distance vector routing uses Bellman-Ford algorithm
Link state routing • Every router maintains its link state packet (LSP) which records the state information of links to all its neighbors. • A router floods its LSP to entire network, i.e., all routers, (whenever its link state changes) • When a router receives LSPs from other routers, it can construct a map of entire network and from the map, compute shortest paths between any pair of host (using Dijkstra algorithm), thus, derive its routing table.
A sample network with associated link costs 2 1 1 3 6 5 2 3 4 1 2 3 2 5 4 Nodes represent routers/switches, edges represent links, The value on a edge represents the cost of using that link. Here we assume each link is nondirected. If a link is directed, the cost can be assigned on each direction. Figure 7.28
Bellman-Ford algorithm • Principle: if node N is in the shortest path from A to B, then the path from A to N is also the shortest path and the path from N to B is also the shortest path. See example • Formalization: • consider node i to a destination d. • define Dj to be the current estimate of minimum cost from node j to destination d. of course Dd=0. • let Cij bethe link cost from node i to node j . Cii=0 and Cij= if i and j are not directly connected. • Di=min{Cij+Dj}, j i = min{Cik+Dk}, k is i’s neighbor. Example • Algorithm (computing shortest path from nodes to destination d): • Initialization: Di= , i d, and Dd=0 • Updating: for each i d, Di=min{Cik+Dk}, k is i’s neighbor • Repeat step 2 until no more changes occur in the iteration.
Shortest path principle 2 1 1 3 6 5 2 3 4 1 2 3 2 5 4 Want to compute shortest path from 2 6, If was told that 16 is 3, then 26 via 1 is 3+3=6 46 is 3, 26 via 4 is 1+3=4 56 is 2 26 via 5 is 4+2=6 therefore shortest path from 26 is achieved if first go to 4. Figure 7.28
Back Shortest path formalization 2 1 1 3 6 5 2 3 4 1 2 3 2 5 4 Want to compute shortest path from 2 6, Suppose D1 = 3, and C21= 3 D4 = 3, C24 = 1 D5 = 2 C25 = 4 therefore shortest path from 26 is computed as D2 =min{C21+D1, C24+D4, C25+D5} = min{3+3, 1+3, 4+2} = 4 Figure 7.28
Shortest path computation to node 6 For each node i, label it as (n,Di) where Di is the current minimum cost from i to the destination and n is the next node along the current shortest path. 2 1 1 3 6 5 2 3 4 1 2 3 2 5 4 Iteration Node 1 Node 2 Node 3 Node 4 Node 5 Initial (-1,) (-1,) (-1,) (-1,) (-1,) 1 (-1,) (-1,) (6,1) (-1, ) (6,2) 2 (3,3) (5,6) (6,1) (3,3) (6,2) 3 (3,3) (4,4) (6,1) (3,3) (6,2) 4 (3,3) (4,4) (6,1) (3,3) (6,2) Figure 7.28
Shortest path tree – from all nodes to a destination 2 1 1 3 6 2 4 1 2 2 5 Figure 7.29
Another view of shortest paths: from a node to all destination suppose for node 2, shortest paths to all other destinations The red lines indicate shortest paths from node 2 to all other nodes. 2 1 1 3 6 5 2 3 4 1 2 3 2 5 4 The routing table in node 2: Destination next node 1 1 3 4 4 4 5 5 6 4 The distance vector in node 2: Destination distance next node 1 3 1 3 3 4 4 1 4 5 4 5 6 4 4 Figure 7.28
How node 2 computes shortest paths to all other destinations After receiving distance vector from 4, node 2 modifies its initial distance vector 2 1 1 3 6 5 2 3 4 1 2 3 2 5 4 New distance vector in node 2 Destination distance next node 1 3 1 3 3 4 4 1 4 5 4 5 6 -1 Initial distance vector in node 2 Destination distance next node 1 3 1 3 -1 4 1 4 5 4 5 6 -1 Receive distance vector from node 4 Destination distance 1 5 2 1 3 2 5 3 6 Figure 7.28
How node 2 computes shortest to all other destination When receiving distance vector from 5, modify its distance vector 2 1 1 3 6 5 2 3 4 1 2 3 2 5 4 Current distance vector in node 2 Destination distance next node 1 3 1 3 3 4 4 1 4 5 4 5 6 -1 New distance vector in node 2 Destination distance next node 1 3 1 3 3 4 4 1 4 5 4 5 6 6 5 Receive distance vector from node 5 destination distance 1 2 4 3 4 3 6 2 Figure 7.28
How node 2 computes shortest to all other destination When receiving distance vector from 4, modify its distance vector again At this time, the distance vector converges to stable state 2 1 1 3 6 5 2 3 4 1 2 3 2 5 4 New distance vector in node 2 Destination distance next node 1 3 1 3 3 4 4 1 4 5 4 5 6 4 4 Current distance vector in node 2 Destination distance next node 1 3 1 3 3 4 4 1 4 5 4 5 6 6 5 Receive distance vector from node 4 Destination distance 1 5 2 1 3 2 5 3 6 3 Figure 7.28
Distributed implementation of Bellman-Ford algorithm • From above example, it is clear that Bellman-Form algorithm can be executed at every node to compute the shortest path from the node to all other nodes (destinations), thus, totally distributed. • The prerequisite is that neighbors exchange distance vectorsperiodically. • Whenever a node receives a distance vector from its neighbor, it checks whether there exists a new shortest path from this neighbor to a destination , if yes, modify its distance vector. • The nodes will receive distance vectors from its neighbors mutually, their computations of shortest paths depend on each other, i.e., in a circular way. However all of them will finally converge to the correct results.
Distributed implementation of Bellman-Ford algorithm(cont.) • Apart from periodical broadcast of distance vector, triggered updates are also used, which means that as soon as a node find its distance vector is changed, the node broadcasts its distance vector. • For each node i, it uses the following equations to compute (or update) its distance vector: • Dii=0 • Dij =min{Cik+ Dkj}, k i where k is i’s neighbor. • In our examples, what we show is from multiple nodes to a specific destination.
Recomputation of minimum cost when link breaks 2 1 1 3 6 5 2 3 4 1 2 3 2 5 4 Assume: computation and transmission are synchronized. Update Node 1 Node 2 Node 3 Node 4 Node 5 Before break (3,3) (4,4) (6,1) (3,3) (6,2) 1 (3,3) (4,4) (4,5) (3,3) (6,2) 2 (3,7) (4,4) (4,5)(2,5) (6,2) 3 (3,7)(4,6) (4,7) (2,5) (6,2) 4 (2,9) (4,6) (4,7)(5,5) (6,2) 5 (2,9) (4,6) (4,7) (5,5) (6,2) eventually converge Figure 7.28
After link failure 1 2 3 4 (b) X 1 1 Counting to infinity problem Before link failure 1 2 3 4 (a) 1 1 1 Update node1 node 2 node 3 Before break (2,3) (3,2) (4,1) After break (2,3) (3,2) (2,3) 1 (2,3) (3,4) (2,3) 2 (2,5) (3,4) (2,5) 3 (2,5) (3,6) (2,5) 4 (2,7) (3,6) (2,7) … … … … The recomputation keeps continuation until costs become very large, and guess the destination is unreachable. How to solve it? On the other hand, if the broken link restored, the recomputation will converge quickly. Therefore, good news travels quickly, but bad news travels slowly. Figure 7.31
Some solutions to counting to infinity problem • Split-horizon • Minimum cost to a given destination is not sent to a neighbor if the neighbor is the next node along the shortest path. • Split horizon with poisoned reverse • Minimum cost to a destination is set to infinity if the neighbor is the next node along the shortest path before sending out the minimum costs.
After link failure 1 2 3 4 (b) X 1 1 Split horizon with poisoned reverse Before link failure 1 2 3 4 (a) 1 1 1 Update node1 node 2 node 3 Before break (2,3) (3,2) (4,1) After break (2,3) (3,2) (-1,) 1 (2,3) (-1,) (-1,) 2 (-1,) (-1,) (-1,) Figure 7.31
Dijkstra’s algorithm & link state routing • Suppose the topology of a network (i.e., a graph) is known, Dijkstra’s algorithm will find the shortest paths from a node n to all other nodes as follows: • Find the closest node (say n1) from node n, which is a neighbor of n. modify the costs of other nodes. • Find the second closest node (say n2) from n, which is a neighbor of n or n1. Modify the costs of other nodes. • Find the third closest node (say n3)from n, which is a neighbor of n, n1, or n2. Modify the costs of other nodes. • …… • How does a node get the network topology? • Every node has a link state packet (LSP) which records its neighbors and the costs to these neighbors. • Every node floods its LSP to the entire network (all nodes) at beginning or whenever link statuses change. • Any node can construct the network topology after it receives all LSPs.
Example: Dijkstra’s algorithm 2 1 1 3 6 5 2 3 4 1 2 3 2 5 4 Iteration N D2 D3 D4 D5 D6 Initial {1} 3 2 5 1 {1,3} 3 24 3 2 {1,2,3} 32 4 7 3 3 {1,2,3,6} 3 2 4 53 4 {1,2,3,4,6} 3 24 53 5 {1,2,3,4,5,6} 3 2453 Figure 7.28
Shortest path tree from node 1 to other nodes after using Dijkstra’s algorithm 2 1 1 3 6 2 3 4 2 2 5 Routing table from shortest path tree for node 1 Destination next node cost 2 2 3 3 3 2 4 3 4 5 3 5 6 3 3 Figure 7.32
Link State Packets 2 1 1 3 6 5 2 3 4 1 2 3 2 5 4 LSP1: (2,3), (3,2),(4,5) LSP2: (1,3),(4,1),(5,4) LSP3: (1,2),(4,2),(6,1) LSP4: (1,5),(2,1),(5,3) LSP5: (2,4),(4,3),(6,2) LSP6: (3,1),(5,2) The LSP of a node records its current neighbors and their current corresponding costs. From LSPs, a node can construct a map of the entire network. Figure 7.28
Comparison of distance vector and link state routings • Distance vector routing • Distance vector records costs to all nodes • Neighborsexchange distance vectors periodically. • The convergence will occur eventually and slowly • Packets may loop for a while during the process of convergence • React to link failure very slowly, counting-to-infinity problem. • Link state routing • LSP records costs to neighbors. • Flood LSP to entire network whenever topology change • React to network failure fast • Too much flood when topology changes quickly and consume network bandwidth • Note: the route from source to destination is distributed and synthesized by all nodes along the route
Other routing approaches --flooding • Flooding • Forwards packets to all ports except the coming port • Packet eventually arrive at destination • No need for routing table, very robust • Problem: may swamp network. • Solutions: • Using TTL (Time-to-live), a small number in the packet, every router decreases it, when reach 0, discards it • Each router adds its identifier into the packet, when sees it again, discards it • Each router records the source and sequence number of a packet, when sees again, discards it • Generally use in specific situation, such as flood LSPs.
Other routing approaches –source routing • Source of a packet puts the entire route in the header of the packet • Intermediate nodes do not need routing ability but forward packets according the router in the header • Need route discovery at first place.
ATM virtual-circuit networks • Fixed-length small cells: 5 byte header + 48 byte data = 53 bytes. • Simplify the implementation of ATM switches and make very high speed operation possible • Many functions can be implemented in hardware • ATM switches are very scalable, such as 10,000 ports with each port running at 150Mbps • Small waiting time and delay • Finer degree of control • ATM can operate over LANs as well as global backbone networks at the speeds from a few Mbps to several Gbps. • QoS attributes allow ATM to carry voice, data, and video. • ATM uses local VCIs, moreover, it uses virtual pathconnection to bundling several VCs with the common path together. Therefore one more level multiplexing. • IP over ATM has been proven to be successful.
Traffic management and QoS • Purpose of traffic management is to provide QoS. • Mechanisms: • Control load on links and switches • Set priority and scheduling at routers/multiplexers to provide differentiated treatments to different packets. • Perform policing and shaping (admission control) • Congestion control. • For a packet, we are interested in • End-to-end delay, also jitter (variation of delay) • Packet loss
Approaches to traffic management • Queue strategies (control sharing of bandwidth among users): • FIFO (First In First Out): • all arriving packets are put in a common queue and sent in the order of arrival. • Packets are discarded when queue (i.e., buffer) is full at the time of arrival • Packet length, queue size, and interarrival time affect the performance • A high rate user will deprive other users of transmitting packets. • FIFO with discard priority • Packets are classified as different types, only discard low priority packets. • Fair Queues • Every user flow has a logical queue, all the queues shares bandwidth equally. • Weighted Fair Queue • Every user flow has a logical queue, but each queue has a specific weight, queues shares bandwidth based on their weights. • The weights may be based on types of traffic, or how much payment.
Random Early Detection (RED) • Problem with fair queue: in core network, too many flows at the same time and tracking the states of all flows is difficult. • One solution is having a limited number of logical queues with each for a given class of flows. But the bad sender may hog the buffer resource. • So RED: randomly drop packets before buffer overflows. • A higher rate source would suffer higher dropped packets. • Two thresholds: minth and maxth, • Below minth, no drop, • From minthmaxth, randomly drop arriving packets with increasing probability • Above maxth, drop all arriving packets.
Congestion control in packet switching networks • When more incoming packets than out-going capacity, buffer is needed • If the situation lasts too long, buffer will be full, packets be discarded, congestion occurs. • Retransmission of lost/discard packets worsen congestion • As a result, the throughput will be very low. • Some ways are needed to control and solve congestion
Congestion control in packet switching networks Question: is it OK to increase buffer size? Not OK. 1.Buffer is larger, then waiting time is longer. It will cause time out and retransmit packets, thus more congestion. If buffer size is infinite, then packet can delay forever. Congestion control is a very hard problem.
Approaches to congestion control • Open-loop (preventive approaches): • If a traffic flow will degrade the network performance and QoS can not be guaranteed, then reject the traffic flow from the beginning. Called admission control. • Leaky bucket traffic policing: • An admitted bad user may violate initial contact and pour too much traffic into network • There is a bucket which controls a constant rate flowing into network. • The user packets are first poured into the bucket, instead of to network. • Once amount of packets into bucket excesses certain level, the further packets will be tagged. If the bucket is full, the extra packets will be discarded. leaky bucket • Whenever congestion occurs, the tagged packets will be discarded • Close-loop (after fact approaches): • After congestion occurred, eliminate or reduce congestion.
Water poured irregularly Water above threshold will be tagged Leaky bucket Water drains at a constant rate Figure 7.53
Traffic policing vs. traffic shaping • Policing: a process of monitoring and enforcing the traffic flow to not violate the agree upon contract (i.e., maximum flow) • Leaky bucket, the bucket size determines maximum allowed flow. • Shaping: a process of altering a traffic flow to avoid burst. • Leaky bucket: varying input to a bucket (buffer) but constant (smooth) output from the bucket (buffer). The bucket size determines the maximum burst. • Token bucket: token bucket for tokens and buffer for packets • tokens are generated at constant rate and put into token bucket. • When token bucket is full, the new generated tokens are discarded. • When a packet comes, • if buffer is empty, check whether there is tokens in token bucket • If has token, the packet is transmitted without entering the buffer (remove one token also), • Otherwise, the packet enters the buffer • Otherwise, the packet enters the buffer • If the buffer is not empty and the token bucket is not empty, constantly take one packet at one time and transmit it (also remove one token)
Size N Shaped traffic Incoming traffic Server Packet Leaky bucket traffic shaping Figure 7.58
Tokens arrive periodically Size K Token Size N Incoming traffic Shaped traffic Server Packet Token bucket traffic shaping Figure 7.59
End-to-end vs. hop-by-hop • End-to-end: the destination notices the sender the congestion. • Hop-by-hop: a node detecting congestion notices its upstream node to slow down, which may detect congestion and notice its upstream node, possible until the source. • Hop-by-hop can react faster than end-to-end.