Download
1 / 9
90 likes | 197 Vues
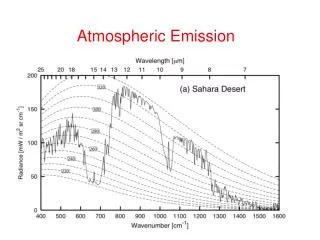
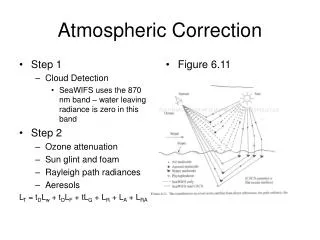
This study explores the full atmospheric correction of the Thermal Emission Imaging System (THEMIS) infrared data, using data from the Thermal Emission Spectrometer (TES) to enhance the analysis of Martian surface composition at a high resolution of 100m/pixel. We assess the effectiveness of this correction to derive atmospheric emissivity values, which correlate well with the anticipated atmospheric spectral dust emissivity. Future work aims to enhance data accuracy by expanding the temporal and spatial range, while also automating the retrieval and processing of data.

E N D
Thermal Emission Imaging System Atmospheric Correction Colin Ho ASU Mars Space Flight Facility Mentor: Phil Christensen
Overview • Full atmospheric correction of Thermal Emission Imaging System IR stamps would provide a valuable source of spectral data that can be used for determining the Martian surface composition at a high resolution (100m/pixel) THEMIS visible stamp and TES mineral map resolution comparison image from JMARS
Objective • To determine if atmospherically correcting Thermal Emission Imaging System (THEMIS) IR spectra using Thermal Emission Spectrometer (TES) data as a basis provides useful data • Assumptions • TES data is pure surface emissivity • General atmospheric composition has little shift over time
Method Selecting an area • Acquiring data • Data access tools • TES – vanilla • THEMIS - THMPROC • Processing data • Programming tool • davinci • Using scripts such as i2i (Christensen) TES pixel outlined upon THEMIS stamp with MOLA in background Image from JMARS
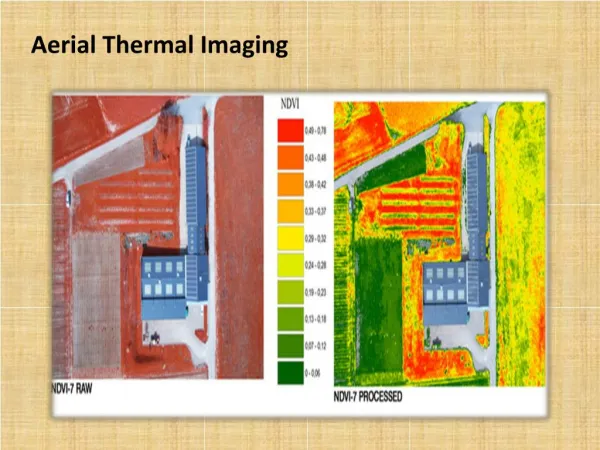
Test Case • Area of 44 to 44.25E, 2.75 to 3N used (day IR) Raw data comparison After processing using i2i
Test Case Results • The derived atmospheric emissivity correlated to the expected atmospheric spectral dust emissivity Atmospheric dust emissivity (Smith, Bandfield, Christensen, 2000) Atmospheric emissivity derived from the difference between TES and THEMIS
Analysis • In the initial test case, the results were found to be suitable for atmospheric correction purposes • Plans for future improvement • Using a larger temporal and spatial spread of data • Applying multiple methods of determining emissivity difference • Automating data retrieval, and processing
Acknowledgments Mentor Philip Christensen Special Thanks Kim Murray
Sources • Smith, Bandfield, Christensen (2000), Separation of atmospheric and surface spectral features in Mars Global Surveyor Thermal Emission Spectrometer (TES) spectra, Journal of Geophysical Research. Vol 105. No E4. Pages 9589-9607 • Bandfield (2002), Global mineral distributions on Mars, Journal of Geophysical Research, 10.1029/2001JE001510. • Mars Global Data, http://jmars.asu.edu/data/ • THMPROC, http://thmproc.mars.asu.edu/ • davinci – Main Page. 6-25-07, “http://davinci.asu.edu/index.php/Main_Page” • Arizona Space Grant Consortium logos. 8-28-08, http://spacegrant.arizona.edu/about/azsgc_logos