Atmospheric Emission
Atmospheric Emission. Absorption and emission. Kirchhoff’s Law implies a correspondence between absorption and emission, including in the atmosphere . Extinguishing medium. Assume ω = 0; no scattering. (where B = B λ (T)). But Kirchhoff’s Law tells us that. Schwarzschild’s Equation.

Atmospheric Emission
E N D
Presentation Transcript
Absorption and emission • Kirchhoff’s Law implies a correspondence between absorption and emission, including in the atmosphere Extinguishing medium Assume ω = 0; no scattering (where B = Bλ(T)) But Kirchhoff’s Law tells us that
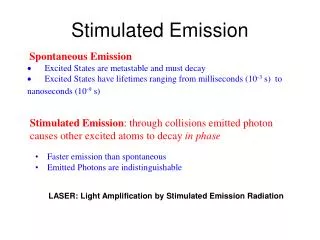
Schwarzschild’s Equation • So the net change in radiant intensity is: • Schwarzschild’s equation is the most fundamental description of radiative transfer in a nonscattering medium (applies to remote sensing in the thermal IR band) • Radiance along a particular direction either increases or decreases with distance, depending on whether I(s) is less than or greater than B[T(s)], where T(s) is the temperature at point s. NB. All quantities represent a single wavelength!
Radiative transfer equation for a nonscattering atmosphere • Some manipulation of Schwarzschild’s Equation yields: • LHS: I(0) is the radiance observed by a sensor at τ = 0 • RHS: • 1) Radiance I at position τ = τ` multiplied by the transmittance t(τ`) = e-τ`between the sensor and τ`. For a down-looking satellite sensor, this could represent emission from the Earth’s surface attenuated by transmission along the line-of-sight. • 2)Integrated thermal emission contributions Bdτ from each point along the line of sight between the sensor and τ`, also attenuated by the path transmittances between the sensor and τ`. Basis for understanding of radiative transfer in a nonscattering atmosphere
Ground-based sensor looking up • For a sensor located at the surface (z = 0), viewing downward emitted radiation from the atmosphere, the appropriate form of the radiative transfer equation is: • where z = ∞ is the ‘top-of-the-atmosphere’ (TOA), t* is the transmittance from the surface to the TOA, and B(z) is the Planck function applied to the atmospheric temperature profile T(z). • W(z) is the emission weighting function: What if the sensor is pointed away from the sun? What if the atmosphere is opaque?
Transmittance spectrum for ozone (O3) http://www.spectralcalc.com/calc/spectralcalc.php
Transmittance spectrum for CO2 http://www.spectralcalc.com/calc/spectralcalc.php
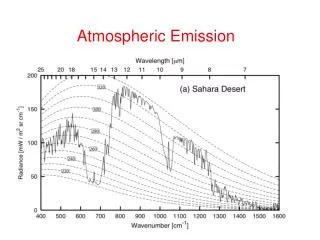
Atmospheric emission spectra Measured using a IR spectrometer, from ground level looking up Planck function curves for 300 K and 245 K shown How do the atmospheric conditions vary between the locations? Where do the spectra match the Planck curves and why? What causes the difference in the spectra at λ > 17 µm? What causes the difference in the atmospheric window region? What happens at 9-10 µm? Based on the 15 µm CO2 band, how does temperature change with height in Alaska?
Satellite-based sensor looking down • For a sensor located in space (z = ∞), viewing upward emitted radiation from the atmosphere, the appropriate form of the radiative transfer equation is: • W(z) is the emission weighting function for upwelling radiation:
Surface contributions to upward intensity • Depends on the nature of the surface (specular, Lambertian etc.) • Three limiting cases: Perfectly transparent atmosphere Perfectly opaque atmosphere (surface reflection/emission irrelevant) Nonreflecting surface (ε = 1) Key point: As the atmosphere becomes more opaque, the measured atmospheric emission originates from higher (and therefore usually colder) levels of the atmosphere
Looking down over the polar ice sheet What is the approximate temperature of the surface of the ice sheet? What is the approximate temperature of the near-surface air? What is the approximate temperature of the air at the aircraft’s flight altitude of 20 km? Looking up from the polar ice sheet What is the feature seen between 9 and 10 µm in both spectra? Can you see any evidence for a temperature inversion in the spectra?
Satellite retrieval of temperature profiles • Requirements: • Strong absorption band that renders the atmosphere opaque over a range of wavelengths. • Well-mixed constituent throughout troposphere and stratosphere (i.e., constant mixing ratio) • CO2 and O2 • Measurements of radiant intensities for a series of closely spaced wavelengths on the edge of a strong absorption band (e.g., 15 µm CO2) Layer average Spike Real Increasingly realistic
Satellite retrieval of temperature profiles Actual weighting functions for channels 4-14 of the Advanced Microwave Sounding Unit (AMSU) Located on the edge of the strong O2 absorption band at 60 GHz Essential for weather forecasting!
Water vapor imagery Image shows water vapor channel (6.5 µm) of GOES-E Water vapor is not well-mixed, so the altitude of the weighting function peak is highly variable Altitude of peak is lower in a dry atmosphere, and higher in a humid atmosphere (or where clouds are present) Geostationary satellite imager server: http://www.ssec.wisc.edu/data/geo/
Transmittance spectrum for H2O http://www.spectralcalc.com/calc/spectralcalc.php