Emission
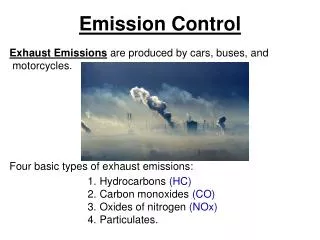
Emission. Emission. Emissions are the amount of pollutant(s) a source puts into the air, usually over a fixed time. Units: mass/time Emissions can vary considerably Variability makes air quality management more challenging Time Location Pollutant. }. Source activity Economic health


Emission
E N D
Presentation Transcript
Emission • Emissions are the amount of pollutant(s) a source puts into the air, usually over a fixed time. Units: mass/time • Emissions can vary considerably • Variability makes air quality management more challenging • Time • Location • Pollutant } Source activity Economic health Population Climate Controls Traffic Examplesof direct influences on emissionsources } Emission variability directly influencing air quality
Classification • There are several ways to categorize emissions. We will examine a few of the more common ways to classify emissions: • By pollutant • By source type • By activity
Classification • Emissions classification by source type • Stationary- sources with a fixed location • Point: usually a large source, often a stack • Area: sources that are addressed as a group rather than individually • Mobile- sources that move • On-road: highway capable vehicles • Non-road: non-highway vehicles • Stationary and mobile sources require very different control strategies. It is important to understand how much originates from such sources.
Pointsource Mobile source Areasource Theory: Classification • Emissions classification by source type • Stationary sources • Mobile sources Stationary Mobile Examples: power plant, chemical plant, etc. Examples: on-road: gas, diesel; off-road: marine, air, agricultural Examples: gas stations, dry cleaners, fireplaces, lawn mowers, tanks farms, etc.
Classification • Describing emissions by source type is also useful for mathematical modeling Gaussian plume model(e.g. ISC-AERMOD) Pointsource Roadway models(e.g. CALINE, CAL3QHC, MOBILE6) Mobile source Flexible source models (e.g. CALPUFF) Areasource
Classification • To make things more complicated, not all emissions are easy to account for and estimate. • Fugitive emissions: Pollutant releases from an unconfined source. Example:-- Windblown dust from a construction site • Accidental emissions: Unintended releases due to accidents, or poor operation and maintenance. Example:-- Evaporation of spilled fuel at a gas station • Natural emissions: Releases from natural processes. Examples:-- Trees release VOCs -- Ocean spray releases salt particles
Classification • Fugitive sources often contribute to ambient particulate matter. Common problem activities: • Construction sites • Agriculture • Unpaved roads 2000 U.S. PM 2.5 Emissions Source: Bureau of Transportation Statistics http://www.bts.gov/publications/national_transportation_statistics/2002/html/table_04_44.html
排放清冊( http://www.ctci.com.tw/air-ei/new_main1-0.htm ) 排放清冊(source inventory)一般是指國家、區域或公司/事業單位等所有活動產生的污染排放總量,故涵蓋的污染源即包括其權轄範圍區域內的所有固定污染源及移動污染源,或點、面、線及自然源(含生物源、火山爆發、海鹽飛沫...)等。 排放量推估 (http://www.ctci.com.tw/air-ei/new_main1-1.htm ) 所謂排放量推估,即針對各類污染源可能會排放至空氣中污染量的多寡進行推估,為空氣污染防制、健康風險管理及管制策略法規研擬等的基礎背景資料。
Emissions Inventory • An emissions inventory is a detailed listing of pollutants emitted from specific sources in a defined area. • A starting point for pollution control is quantifying the emissions being released into the atmosphere. • Therefore, an emissions inventory is essential to provide a current, accurate, and comprehensive listing of air pollution emissions within a specific area over a specified period of time. Source: USEPA, 2003, Principles and Practices of Air Pollution Control, Student Manual. Ch. 8, Emissions Inventory
Purposes of an EmissionsInventory • Pollutant Identification • Effect Studies • Emission Reactivity • Compliance • Policy Development • Ambient Air Monitoring • Agency Requirements Source: USEPA, 2003, Principles and Practices of Air Pollution Control, Student Manual. Ch. 8, Emissions Inventory
Emission Estimation • 直接推估法:由量測排放污染物的濃度配合量測之體積流量推估而得,最常應用在工廠煙囪/排放口的排放量推估。(e.g. CEM, stack test) • 質量平衡法:排放率不易直接量測,可由物質輸入與輸出間的平衡關係進行估算。 • 工程計算方法:利用物質成份特性及理論公式進行估算。 • 排放係數推估法:為間接推估方法,利用一具代表性的係數因子配合活動強度進行推估。
Methods of estimating sourceemissions include • Continuous Emission Monitors (CEM) • Source Testing • Material Balance • Emission Factors • Fuel Analysis • Emission Estimation Models • Surveys and Questionnaires • Engineering Judgment Source: USEPA, 2003, Principles and Practices of Air Pollution Control, Student Manual. Ch. 8, Emissions Inventory
直接推估法 • 利用煙道檢測(source testing)或連續排放監測(CEM)來推估排放量是最可靠的方法,但需較高成本,實際上僅能做有限的量測,針對重要者、重點處或特殊者才進行實地測定;
Mass balance • A simple, but useful, accounting tool for pollutants • Emissions are determined based onthe amount of material that enters a process, theamount that leaves the process, and the amountshipped as part of the product itself. • A simple way to estimate emissions, particularly for fugitive releases mass movinginto a system mass consumed orproduced by reactions • • • mass movingout of a system change in mass over some time
Mass balance • A benzene storage tank has the following data. Fugitive losses are suspected from the tank, but cannot be measured easily. Use a mass balance. Tank capacity = 10,000 kg (constant level) Mass in from chemical plant = 1000 kg/day Mass out to transport vehicle tanks = 998 kg/day = 0(no chemicalreactions in tank) = 1000 kg/day = 0(tank mass is constant) • • • = 998 kg/day + fugitive loss 0 = 1000 - (998 + fugitive) + 0 fugitive loss = 2 kg/day benzene
Fuel analysis • Emissions are determined based on theapplication of conservation laws. The presence of certainelements in fuels may be used to predict their presencein emission streams. For example, SO2 emissions fromoil combustion can be calculated based on theconcentration of sulfur in the oil. This approach assumescomplete conversion of sulfur to SO2. Therefore, forevery pound of sulfur burned (molecular weight = 32g),two pounds of SO2 are emitted (molecular weight = 64g). Source: USEPA, 2003, Principles and Practices of Air Pollution Control, Student Manual. Ch. 8, Emissions Inventory
有一火力發電廠發電量為500MW,所用的煤其LHV=30000J/g,如果能源轉換效率為0.4,請問此電廠每天使用多少煤? • 上述電廠使用的煤含硫量為2%(重量比) ,如果所有燃料中的硫都轉換為SO2由煙囪中排放,請問此一煙囪SO2的排放率為若干g/sec? 如果加裝FGD(排煙脫硫),且SO2去除率為80%,則此一煙囪SO2的排放率為若干g/sec? • 假設煙道中廢氣流量在150℃,1大氣壓時為80m3/sec,假設廢氣的分子量可視為28.5,求上題中裝了FGD以後廢氣中SO2濃度為多少ppm?
Process modeling • Process modeling • Attempts to describe emissions as a function of relevant process information • Models are process specific
Process modeling – MOBILE6 • MOBILE6 is a model for predicting emissions from vehicles. Capabilities: • Various pollutants: CO, CO2, NOx, PM, toxics, hydrocarbons • Various vehicle types: cars, trucks, motorcycles • Various operating conditions: speed, temperature, etc. • Various fuel types: gasoline, diesel
Estimation • TANKS is software to model VOC emissions from storage tanks, based on AP-42 • Features • Uses chemical, meteorological, and tank design information • Database includes 100 chemicals, met data for 240 cities • Can calculate individual chemical emissions from known mixtures
Emission Factor • Emission Factor Modeling • Emission factors relate the air pollution released by a source activity to the magnitude of that activity • Emission factors are the best estimate of the most likely values based on literature reviews • Factors are source activity specific activity rate control efficiency (0 to 1) emission emission factor(obtained from AP-42)
「排放係數」或稱「排放因子」(Emission Factor)之定義為「每單位生產量(或能源消耗量或服務量)所排出空氣污染物的量」,大多數狀況下是由可取得的且品質可被接受的數據平均之結果,一般假設其可代表某類污染源的平均排放狀況。「活動強度」(Activity Intensity)是指一段時間內之生產量(或能源消耗量或服務量)大小,主要配合排放係數之單位項目代入推估。「控制因子」係指污染源受到控制後與控制前之排放量比值,其等於(1-污染控制設備或措施的削減率)。「排放係數」、「活動強度」及「控制因子」為排放量推估所需蒐集與彙整的三大資料。 Source: http://www.ctci.com.tw/air-ei/new_main1-2.htm
Emission Factor • A lime manufacturing facility using a coal-fired rotary kiln has a PM10 emission factor of 22 kg/Mg, as found in AP 42 (Chapter 11, section 17: Lime Manufacturing). The emission factor has a D rating. • Translation: • For every 1000 kg of lime processed, 22 kg of PM10 will be created (final emissions depend on whether control technologies are used on the airstream) • However, the D rating suggests this emission factor has a high degree of uncertainty • Use the numbers carefully
Example Consider an industrial boiler that burns 90,000 liters of distillate oil per day. In Section 1.3 of AP-42, "Fuel Oil Combustion", the CO emission factor for industrial boilers burning distillate oil is 0.6 kilograms (kg) CO per 103 liters of oil burned. Then CO emissions = CO emission factor x distillate oil burned/day = 0.6 x 90 = 54 kg/day Source: AP-42, Introduction, http://www.epa.gov/ttn/chief/ap42/c00s00.pdf
Suppose a sulfuric acid (H2SO4) plant produces 200 Mg of 100 percent H2SO4 per day by converting sulfur dioxide (SO2) into sulfur trioxide (SO3) at 97.5 percent efficiency. In Section 8.10, "Sulfuric Acid", the SO2 emission factors are listed according to SO2-to-SO3 conversion efficiencies in whole numbers. The reader is directed by footnote to an interpolation formula that may be used to obtain the emission factor for 97.5 percent SO2-to-SO3 conversion. The emission factor for kg SO2 /Mg 100% H2SO4 = 682 - [(6.82)(% SO2-to-SO3 conversion)] = 682 - [6.82)(97.5)] = 682 - 665 = 17 kg In the production of 200 Mg of 100 percent H2SO4 per day, SO2 emissions are calculated thus: SO2 emissions = 17 kg SO2 emissions/Mg 100 percent H2SO4 x 200 Mg 100 percent H2SO4/day = 3400 kg/day Source: AP-42, Introduction, http://www.epa.gov/ttn/chief/ap42/c00s00.pdf
某一600 MW 之燃煤火力發電廠燃燒熱值為27 kJ/g 之煤炭發電,已知該發電廠之整廠發電效率為39%,煤炭之含碳量及含硫量分別為72%及1.5%,假設燃燒後煤中之碳及硫皆分別完全氧化為CO2及SO2,而當地法規規定每輸入百萬焦耳(MJ)之熱值,SO2之排放限值為0.25 g(即0.25 g SO2 /MJ input):試計算該電廠每日之用煤量為何? 為達SO2 排放限值,該電廠排煙脫硫設備所需之SO2去除效率為何?(S = 32)試計算該電廠每年之二氧化碳排放量及二氧化碳排放係數(以kgCO2 /kWh 表示)。
Emission Factor Ratings • Each AP-42 emission factor is given a rating from A through E, with A being the best. A factor’s rating is a general indication of the reliability, or robustness, of that factor. • Two steps are involved in factor rating determination. • The first step is an appraisal of data quality, the reliability of the basic emission data that will be used to develop the factor. • The second step is an appraisal of the ability of the factor to stand as a national annual average emission factor for that source activity. Source: AP-42, Introduction, http://www.epa.gov/ttn/chief/ap42/c00s00.pdf
Data quality • Test data quality is rated A through D, and ratings are thus assigned: • A = Tests are performed by a sound methodology and are reported in enough detail for adequate validation. • B = Tests are performed by a generally sound methodology, but lacking enough detail for adequate validation. • C = Tests are based on an unproven or new methodology, or are lacking a significant amount of background information. • D = Tests are based on a generally unacceptable method, but the method may provide an order-of-magnitude value for the source. Source: AP-42, Introduction, http://www.epa.gov/ttn/chief/ap42/c00s00.pdf
AP-42 emission factor quality ratings are thus assigned: A — Excellent. Factor is developed from A- and B-rated source test data taken from many randomly chosen facilities in the industry population. The source category population is sufficiently specific to minimize variability. B — Above average. Factor is developed from A- or B-rated test data from a "reasonable number" of facilities. Although no specific bias is evident, it is not clear if the facilities tested represent a random sample of the industry. As with an A rating, the source category population is sufficiently specific to minimize variability. C — Average. Factor is developed from A-, B-, and/or C-rated test data from a reasonable number of facilities. Although no specific bias is evident, it is not clear if the facilities tested represent a random sample of the industry. As with the A rating, the source category population is sufficiently specific to minimize variability. D — Below average. Factor is developed from A-, B- and/or C-rated test data from a small number of facilities, and there may be reason to suspect that these facilities do not represent a random sample of the industry. There also may be evidence of variability within the source population. E — Poor. Factor is developed from C- and D-rated test data, and there may be reason to suspect that the facilities tested do not represent a random sample of the industry. There also may be evidence of variability within the source category population.
Approach to emission estimation Source: AP-42, Introduction, http://www.epa.gov/ttn/chief/ap42/c00s00.pdf
假設泥煤中碳(C)含量佔其質量的67%,其熱值(heating value)為28400kJ/kg;天然氣中C佔74%,熱值為54400kJ/kg,依此條件計算,當釋出能量相同時,泥煤排放的CO2是天然氣的幾倍?
AP-42 • Published emission factors are available in numerous sources. The US EPA’s AP-42 series is one of these publications and is available electronically at: http://www.epa.gov/ttn/chief/. • Emission factors in AP-42 are neither EPA recommended emission limits nor standards. • Emission factor ratings in AP-42 provide indications of the robustness, or appropriateness, of emission factors for estimating average emissions for a source activity. Usually, data are insufficient to indicate the influence of various process parameters such as temperature and reactant concentrations.
Taiwan Emission Data System (TEDS) • 環保署於民國79~81年期間委託美國凱瑟工程公司,執行「北中南高地區空氣污染物排放總量調查及減量規劃」,亦以民國77年為基準年,計畫中對於排放量推估進行更詳細之探討及解析,將排放量之解析度以1平方公里之方式呈現,於81年完成了第一版台灣地區排放量資料庫(Taiwan Emission Data System),簡稱為[TEDS1.0版]資料庫。 • 為掌握全國實際排放量之變動,每隔幾年就進行基準年排放量的大幅更新推估,並據以修正逐年排放趨勢。 • 目前最新版本為TEDS7.1版,詳細資料請見:http://www.ctci.com.tw/air-ei/new_main2-0.htm
Further Learning • Emissions Measurement Center, http://www.epa.gov/ttn/emc/ • Air Pollution Emissions Overviewhttp://www.epa.gov/oar/oaqps/emissns.html • National Emission Inventory (NEI) Database for Criteria and Hazardous Air Pollutants, http://www.epa.gov/ttn/chief/net/ • Scorecard, an online tool to investigate pollution in your neighborhood, http://www.scorecard.org • Emission models, http://www.epa.gov/ttn/chief/emch/software/index.html • Compilation of Air Pollutant Emission Factors, Volume 1: Stationary Point and Area Sources, AP 42, http://www.epa.gov/ttn/chief/ap42/index.html • AirData, online access to emissions at the county level and up, http://www.epa.gov/air/data/ • A Guide to Mid-Atlantic Regional Air Quality, Part IV: Pollution Sources, pp. 47-58. http://www.epa.gov/ttn/chief/ap42/oldeditions.html
Reference Methods for emission measurement • The original U.S. EPA Reference Methods (FRM) 1 through 8, first promulgated in 1971, were “wet chemistry” methods applied to sampling and analyzing particulate matter, and nitrogen oxides. • Each Federal Reference Method governs the procedures, equipment, and sampling of source emissions: • FRM 1 – Point Locations • FRM 2 – Gas Flow Rate • FRM 3 – Gas Molecular Weight • FRM 4 – Gas Moisture Content • FRM 5 – Particulate Matter • FRM 6 – Sulfur Dioxide • FRM 7 – Nitrogen Oxides • FRM 8 – Sulfuric Acid Mist Source: USEPA, 2003, Principles and Practices of Air Pollution Control, Student Manual. Ch. 7, Measurement of pollutant emission
固定污染源檢測 • 固定污染源的檢測工作相當複雜,要採取煙道(包括管道、煙囪、排氣管路)排氣中之粒狀污染物,測定其濃度或其內組成份含量時,所需的工作包括:(1)測定點之選定(2)排氣組成之測定(3)排氣含水量之測定(4)排氣溫度測定(5)排氣流速量測定(6)等速吸引(7)採樣,
Variation of gas velocity in a rectangular duct and Method 1 traverse points Since the gas velocity and particulate concentration may vary from point to point, EPA requires that sampling be performed over the cross-section, not at just one point. This requires the application of Method 1 criteria which lays out the grid of points at which one is to obtain a sample. In this figure, an imaginary grid is superimposed on the rectangular duct. When performing Method 5, sampling is conducted at each point of the grid to obtain an area-averaged total sample. Source: APTI 450
Representative Point Selections 原則上應避免在排放管道彎曲部分或截面形狀急遽變化的部分進行採樣,而應選在排氣氣流經整流後較為一致的地方,並應選在測定作業安全且易測定的場所。故正常測定位置應選在離彎曲、收縮或放大管道口之下游 8 倍管道直徑以上且在其離彎曲、收縮或放大管道口之上游 2 倍管道直徑以上之處;當無法在上述條件設置適當測定孔時,則至少應選在離彎曲、收縮或放大排放管道口之下游 1.5 倍至 8 倍管道直徑且在其離彎曲、收縮或放大管道口之上游 0.5 至 2 倍管道直徑之處。
於排放管道面設測定孔,其內徑約為 100 ~ 150 mm,如右圖所示,未測定時以適當的盲板密封。測定時插入之裝置與測定孔間之空隙,應用耐熱材料等予以密封。 • 檢測時需選擇數點進行測定,測定點的位置和所需點數請參考規定。
排氣組成之測定裝置(NIEA A003.71C) • 固定污染源採樣分析時需測定廢氣中二氧化碳、一氧化碳和氧的濃度, • 這些測定的目地有二:一為決定廢氣的分子量,以算出排氣流速和等速吸引。二為用於燃燒設備排氣標準含氧量之換算。 • 下圖為Orsat分析儀,內有吸收瓶,二氧化碳之吸收液為氫氧化鉀溶液,氧氣之吸收液為氫氧化鉀和焦性沒食子酸溶液的混合,一氧化碳的吸收液為CuCl和濃氨水的混合,將氣體通過吸收液,然後測定其減少的體積,即可求出乾燥氣體中二氧化碳、一氧化碳和氧的濃度。
A typical Orsat analyzer for measuring %02, %C02, and %CO Source: USEPA, 1995, APTI 450 Source Sampling for Particulate Pollutants, student manual.
煙道中乾燥廢氣的分子量可用下式計算 Md = 0.440 (%C02) + 0.320 (%02) + 0.280 (%N2 + %CO) 過去Orsat分析儀常用於決定%C02, %02, 和 %CO。而%N2之值則為100- %C02 - %02 - %CO。 Orsat? Requires antiquated equipment, mildly hazardous materials, and time… Today, the Orsat method has been largely supplanted by the use of analyzers. Method 3Aallows the use of automated, instrumented techniques to determine the percentage of component flue gases. The instruments tend to be more accurate than the Orsat method since the ambiguities associated with proper technique are largely removed. Source: USEPA, 1995, APTI 450 Source Sampling for Particulate Pollutants, student manual.
Method 3A • For the determination of 02and CO2only when specified within the regulations • A sample is continuously extracted from the effluent stream. A portion of the sample stream is sent to an instrumental analyzer(s) for the determination of 02 and CO2concentrations. • CO2 Analyzers • Nondispersive infra-red • Polarography • 02 Analyzers • Paramagnetism • Polarography • Electrocatalysis