Download
1 / 20
200 likes | 301 Vues
This study examines the atmospheric emission signal in sub-mm experiments, focusing on modeling and data reduction techniques. Utilizing a fluid dynamic model and gaussian field approximation, the research reveals large-scale features of the emission, along with challenges in modeling wind effects and correlated structures. Despite common-mode data, residual analysis suggests the presence of small-amplitude structures. The study explores direct detection methods and concludes that while a simple mean subtraction may help mitigate the atmospheric signal, more sophisticated analysis is needed to fully characterize the emission.

E N D
The Atmospheric Emission Signal as seen with SHARC-II Alexander van Engelen University of British Columbia
Who am I? • Working with: • Douglas Scott (UBC) • Andy Gibb (UBC) • Tim Jenness (JAC, Hilo HI) • Dennis Kelly (UK ATC, Edinburgh) on the data reduction pipeline software for SCUBA-2 • Scanmap research
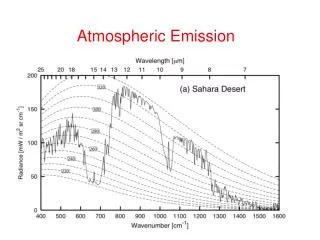
In sub-mm experiments, atmospheric emission due to water vapor is the strongest component of the data Bright Varies on long spatial and temporal scales For data reduction studies it is important to model this in a useful and accurate way Introduction
Current Model • Use a fluid dynamic model (Kolmogorov) to describe the characteristics of the signal • In SCUBA-2 simulations the emission from various altitudes is approximated by a single, constant screen of emission • Gaussian 2-D random field • Fixed at an altitude of ~800 m, and blows past the observatory at the local wind speed
Atmospheric Emission Image • Features here are very large • This constant screen blows past the observatory at ~15 m/s (~5000 arcsec/sec)
SCUBA-2 scanmap basics • Simple raster scan • To fill in the under-sampled 450μm array, scan at an angle of arctan(1/2)≈26.5° to array axes (courtesy D, Kelly)
SCUBA-2 scanmap simulation • Simulated scan over a regular 2-d array of point sources • Just a simple reprojection of the time series onto a map – nothing fancy here! • Note streaks due to atmospheric emission signal
Issues • Is this truly a Gaussian random field? • Power spectrum? • Constant wind vector? • Component on scales smaller than the array? • How stable are the properties of the screen?
In order to learn more about the properties of this signal Colin Borys kindly gave us some SHARC-II data • Lissajous scan of MS0451 • considered to be faint enough that source flux can be neglected here
Sample spectra Model predicts (in the timestream)
Animation From a data reduction perspective we are interested in whether the atmosphere is completely described by a common-mode signal.
Residual after common-mode subtraction Still some correlated structures remaining
Zero-timelag cross-correlations in residuals -Difficult to understand
Direct detection of Kolmogorov model? (I) • Compare derivative of array mean with slope of fit plane across the array; positive correlation indicates a comfirmation • It turns out that for the SHARC-II data the gradient is overwhelmed by instumental effects.
Direct detection of Kolmogorov model? (II) • There should be a shift in the signal (of a fraction of a sample) between detectors if the wind speed is reasonable • Unfortunately it is difficult to measure this explicitly.
Conclusions • Since the data is so common-mode, subtracting a simple mean is not ruled out as a way of dealing with the atmospheric emission signal. However, there seem to be some small-amplitude correlated structures that remain. • No direct detection of the wind-blown screen model was made in SHARC-II data.