Download
1 / 32
320 likes | 443 Vues
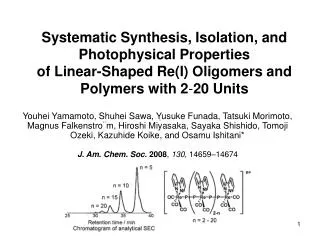
Systematic Synthesis, Isolation, and Photophysical Properties of Linear-Shaped Re(I) Oligomers and Polymers with 2 - 20 Units. ,.

E N D
Systematic Synthesis, Isolation, and Photophysical Propertiesof Linear-Shaped Re(I) Oligomers and Polymers with 2-20 Units , Youhei Yamamoto, Shuhei Sawa, Yusuke Funada, Tatsuki Morimoto, Magnus Falkenstro¨m, Hiroshi Miyasaka, Sayaka Shishido, Tomoji Ozeki, Kazuhide Koike, and Osamu Ishitani* J. Am. Chem. Soc. 2008, 130, 14659–14674
Linear-Shaped Metal Oligomers [Co5(5-tpda)4(NCS)2] [Ni5(5-tpda)4CI2] Shie-Ming Peng .Angen. Chem. Inr. Ed. Engl.1997, 36, 56
Motivation • Excellent emitters Room-temperature luminescence, long lifetime High emission quantum yield • Molecular-scale photonic wires
Photochemical Ligand Substitution Reaction Ishitani, O, et. Al, J. Am. Chem. Soc. 2002, 124, 11448–11455. Schoonover, J. R. et. al, Inorg. Chem. 2001, 40, 5056–5057.
Synthesis of a linear-shaped rhenium(I)diimine complexes Ishitani, O, et. Al, Chem. Commun., 2001, 1514–1515
Photophysical Properties of linear-shaped rhenium(I) diimine complexes Fig. 1 (b) emission spectra (350 nm excitation) of 14+, 2b3+, 32+ and 5+ in acetonitrile. Ishitani, O, et. Al, Chem. Commun., 2001, 1514–1515
“Target molecules” “Complex as metal” “Complex as ligand” Synthetic Strategy LL x
Synthesis of Linear-Shaped Rhenium(I) Complexes ac = -PPh2-CC-PPh2- h (>330 nm) excess ac fac-Re(bpy)(CO)3(CF3SO3) 0.5 eq ac (i)h (>330 nm) in CH2Cl2 for 30 min; (ii) excess ac in CH2Cl2 at room temperature for 1 day, then at 40 °C for 1 day; (iii)fac-Re(bpy)(CO)3(CF3SO3) in CH2Cl2 at room temperature for 1 day, then at 40 °C for 1 day; (iv) ac (0.5 equiv) in CH2Cl2 at room temperature for 1 day, then at 40 °C for 1 day.
Synthesis of Oligomers with 5 and 7 Re(I) Units Yield = 32% • h (>330 nm) in CH2Cl2 for 1 h; • [Re2ac(η1-ac)1]2+ in CH2Cl2 at room temperature for 1 day, then at 40 °C for 1 day.
Synthesis [Re5ac]5+ in higher yield Yield = 66%
Synthesis of Linear-Shaped Re(I) Polymers (i)h (>330 nm) in MeCN for 1 h; (ii) excess ac in acetone/THF (1:1) at room temperature for 1 day, then at 40 °C for 1 day; (iii) in acetone/THF (1:1) at room temperature for 1 day, then at 40 °C for 2 days.
Separation Using Size Exclusion Chromatography Figure S3. Chromatograms of analytical SEC. Reaction mixture (a), with isolation of [Re5ac]5+, [Re10ac]10+, [Re15ac]15+, and [Re20ac]20+. The eluent was a 1:1 (v/v) mixture of methanol and acetonitrile containing 0.3 M CH3CO2NH4, and the flow rate was 5.0 ml min-1. The detection wavelength was 360 nm.
ESI FTMS spectrum of [Re8ac]8+(PF6-)8. ESI FTMS = electrospray ionization Fourier transform mass spectrometry Figure 1. ESI FTMS spectrum of [Re8ac]8+(PF6-)8. The eluent was MeCN. Figure 2. ESI FTMS spectrum of the scale-extended segment for the seven charged [M + (PF6-)]7+ (a) and calculated isotope distribution patterns(b).
Hi6 Hi3 Hi4 Hii5 Hii5+Hiii5 Aromatic regions in 1H NMR spectra
Identify the Longest Isolated Polymer Made from [Re5ac]5+ by 1H NMR the number of Re(I) units is20.42.0 Figure 4. Relationship between the number of Re(I) units in the oligomers and polymers and ratios of the integrated areas of their 1H NMR signals,A(H5 i + H5ii)/A(H6iii) (n = 3, 4, 6), measured in acetone-d3 at room temperature. See the structure as shown in Figure 3 for numbering of the protons. The red circle is the longest isolated polymer made from [Re5ac] 5+.
IR spectra (interiorRe-CO) [Re8ac]8+ [Re6ac]6+ (edge Re-CO) [Re4ac]4+ [Re2ac]2+ Figure 5. IR spectra of [Re2ac]2+ (dotted line), [Re4ac]4+ (blue line), [Re6ac]6+ (red line), and [Re8ac]8+ (solid black line) measured in MeCN. They are standardized by the absorbance at 2048 cm-1.
Identify the Longest Isolated Polymer Made from [Re5ac]5+ by Ratio of (CO) the number of Re(I) units is20.10.4 Figure 6. Relationship between the ratios of the ν(CO) peak areas due to edge units (2048 cm-1) and interior units (1885 cm-1) of [Re2ac]2+ to [Re16ac]16+ (black dots), and the number of Re(I) units. The red circle is the polymer for the longest isolated polymer made from [Re5ac]5+.
the number of Re(I) units is20.63.7 Identify the Longest Isolated Polymer Made from [Re5ac]5+ by Size Exclusion Chromatography. Figure 7. The logarithm of the molecular weight plotted against the distribution coefficient (KSEC) of the Re(I) oligomers and polymers. The red circle shows the longest isolated polymer made from [Re5ac]5+.
Bond Lengths “Trans” - type Bond Angles Inversion center π-π interaction ORTEP diagram of [Re2ac]2+(PF6-)2
π-π interaction Packing diagram of [Re2ac]2+(PF6-)2 Figure S4. Packing diagram of [Re2ac]2+(PF6-)2, PF6- and hydrogen atoms omitted for clarity.
ORTEP diagram of [Re3ac]3+(PF6-)3 Mirror plane Bond Lengths U-shaped Bond Angles
ORTEP diagram of [Re3et]3+(PF6-)3 Bond Lengths U-shaped Bond Angles et = -PPh2-(CH2)2-PPh2-
ORTEP diagram of [Re4et]4+(PF6-)4 Circle-like structure
MLCT UV-vis absorption spectra Figure 9. UV-vis absorption spectra of MeCN solutions containing [Re2ac]2+ to [Re20ac]20+
Subtracted spectra UV-vis absorption spectrum Figure 10. Subtracted spectra UV-vis absorption spectrum of [Re2et]2+ from those of [Re3et]3+ - [Re7et]7+, divided by the number of the biscarbonyl complex units; the red line is the UV-vis absorption spectrum of fac-[Re(bpy)(CO)2(PPh2Pr)2]+ in MeCN. Figure 9. Subtracted spectra UV-vis absorption spectrum of [Re2ac]2+ from those of [Re3ac]3+ to [Re20ac]20+, divided by the number of biscarbonyl complex units .
Red shift Emission spectra Figure 11. Emission spectra from degassed MeCN solutions containing [Re2ac]2+ to [Re20ac]20+ standardized by the absorbance at the excitation wavelength 350 nm.
(a) Monitor : 500 nm (b) Monitor : 650 nm Main: 10 ns Minor: 100 ns, 734 ns Main: 113 ns, 750 ns Minor: 10 ns Emission decay curves of [Re8ac]8+ Emission decay curves obtained at excitation wavelength of 365 nm. Iem(t)= A1 et⁄τ1 + A2 et⁄τ2 +A3 et⁄τ3
Time resolved emission spectra of [Re8ac]8+ Figure 13. Time resolved emission spectra of [Re8ac]8+. Black, red, and blue lines are emission spectra with lifetime of 10, 100, and 750 ns,respectively. = 10 ns is emission from the 3MLCT excited-state of the edge Re(I) units.
Table 3. Photophysical Properties of [Re2ac]2+ to [Re20ac]20+ in a Deoxygenated Acetonitrile Solution at 25 °C, and Energy Transfer Rates from the Edge Unit to the Interior Unit in [Re3ac]3+ to [Re20ac]20+ aAll complexes were PF6- salts. The excitation wavelength was 350 nm. bEmission maximum. cQuantum yield of emission. dLifetime. Numbers in parentheses are percentages of pre-exponential factors, Photophysical Properties Ket Kr
cis,trans-[Re(bpy)(CO)2(PPh3)2]+ MeCN/toluene mixed solution effect em em Kr Figure 14. Dependence of Φem on toluene content in an MeCN/toluene mixed solution.
Conclusions • We applied photochemical ligand substitution reactions of Re(I) diimine complexes with a phosphorus ligand, to find systematic synthetic routes for linear-shaped rhenium(I) oligomers and polymers bridged with bidentate phosphorus ligands. • For oligomers and polymers with 3 Re(I) units, energy transfer from the edge unit to the interior unit occurs with a rate constant of (0.9 × 10⁸)-(2.5 × 10⁸) s-1. • Crystal structures were obtained of some trimers and a tetramer, showing interligand π-π interaction between the diimine ligand and the phenyl groups on the phosphorus ligand. • Both emission and analytical SEC data indicate that the Re(I) polymers aggregate intramolecularly in an MeCN solution.