Download
1 / 6
60 likes | 156 Vues
Learn to analyze when and how to use the Normal Distribution, compare distributions, find probabilities, and perform hypothesis tests on a single mean. Practice testing a theory about student intelligence based on height data.

E N D
The Normal distribution – Lesson 2 • At the end of this topic we aim to .... • understand when and why we use the Normal Distribution • understand the features of a Normal distribution • can compare different Normal Distributions • use the Normal Distribution to find probabilities • use the inverse Normal function • carry out hypothesis test on single mean • use the Normal distribution to approximate Binomial and Poisson situations
Carry out hypothesis test on single mean Situation: You may assume that height of 17/18 year olds is normally distributed with a mean of 163cm and a standard deviation of 14cm. Mrs Lehmann thinks that intelligent students are taller and wants to test this using the data from her year 13 students(assuming that her students are more intelligent than average). In order to test this Mrs Lehmann works with a sample of 12 students, their mean height is 165cm, to keep it simple we assume a standard deviation of 14cm. Does this result support her idea?
Use 5 steps of any hypothesis test Establish H0 and H1 2. Decide on Significance level 3. Collect suitable data using a random sampling process ensuring all items are independent 4.Conduct test, doing necessary calculations 5. Interpret results in terms of original claim
Now look at iii) from the starter question. Can we link this to our 5 steps: 5 steps of any hypothesis test Establish H0 and H1 Decide on Significance level Collect suitable data using a random sampling process ensuring all items are independent Conduct test, doing necessary calculations Interpret results in terms of original claim But careful, the mark scheme is VERY peculiar!
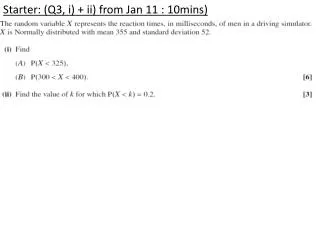
Hh І-1.058 І < І1.96 І P76, 3A, Q2…