Reordering Diffusion-Based Connectivity Matrices to Define Anatomical Networks in the Human Brain
This study presents a computationally efficient algorithm for analyzing complex diffusion tractography data, aiming to extract interconnected networks within the human brain. Utilizing Ncut spectral reordering, we demonstrate how to identify and visualize functional clusters corresponding to distinct brain regions, particularly within the primate visual system. By examining the relationships among connectivity patterns initiated from various seed voxels, we enhance our understanding of the brain's anatomical organization, revealing critical insights into intra- and inter-connectivity of functionally related areas.

Reordering Diffusion-Based Connectivity Matrices to Define Anatomical Networks in the Human Brain
E N D
Presentation Transcript
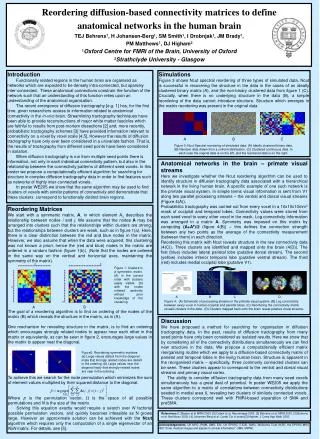
Reordering diffusion-based connectivity matrices to define anatomical networks in the human brainTEJ Behrens1, H Johansen-Berg1, SM Smith1, I Drobnjak1, JM Brady1, PM Matthews1, DJ Higham21Oxford Centre for FMRI of the Brain, University of Oxford2Strathclyde University - Glasgow FMRIB A B C Figure 3: Ncut Spectral reordering of simulated data: (A) Ideally clustered binary data. (B) Random data drawn from a uniform distribution. (C) Clustered continuous data. In each case the original data is on the left, and the reordered data is on the right. Figure 1: Clusters in a symmetric matrix. (A) in the correct order with clusters easily visible. (B) with the nodes ordered randomly without prior knowledge of the clustering. A B Figure2: Reordering symmetric matrices. (a) Large values distant from the diagonal imply that strongly related nodes are distant in the ordering. (b) Large values near the diagonal imply that strongly related nodes are near in the ordering. A B C D Introduction Functionally related regions in the human brain are organised as networks which are expected to be densely intra-connected, but sparsely inter-connected. These anatomical connections constrain the function of the network such that an understanding of this function relies upon an understanding of the anatomical organisation. The recent emergence of diffusion tractography [e.g. 1] has, for the first time, given researchers access to information related to anatomical connectivity in the in-vivo brain. Streamlining tractography techniques have been able to provide reconstructions of major white matter fascicles which are faithful to results from post-mortem dissections [2] and, more recently, probabilistic tractography schemes [3] have provided information relevant to connectivity on a voxel by voxel scale [4,5]. However the results of diffusion tractography have only ever been considered in a univariate fashion. That is, the results of tractography from different seed points have been considered in isolation. When diffusion tractography is run from multiple seed points there is information, not only in each individual connectivity pattern, but also in the relationship between the connectivity patterns of different seed voxels. In this poster we propose a computationally efficient algorithm for searching for structure in complex diffusion tractography data in order to find features such as networks of highly inter-connected voxels. In poster WE205 we show that the same algorithm may be used to find clusters of voxels with similar patterns of connectivity and demonstrate that these clusters correspond to functionally distinct brain regions. Simulations Figure 3 shows Ncut spectral reordering of three types of simulated data. Ncut is successful in recovering the structure in the data in the cases of an ideally clustered binary matrix (A), and the non-binary clustered data from figure 1 (C). Crucially, when there is no underlying structure in the data (B), a simple reordering of the data cannot introduce structure. Structure which emerges in the matrix reordering was present in the original data. Anatomical networks in the brain – primate visual streams Here we investigate whether the Ncut reordering algorithm can be used to identify structure in diffusion tractography data associated with a hierarchical network in the living human brain. A specific example of one such network is the primate visual system. In simple terms visual information is sent from V1 along two parallel processing streams – the ventral and dorsal visual streams (Figure 4(A)). Probabilistic tractography was carried out from every voxel in a 10x10x10mm3 mask of occipital and temporal lobes. Connectivity values were stored from each seed voxel to every other voxel in the mask. Log connectivity information was arranged in a matrix A. Symmetry was imposed on this matrix by computing (A+AT)/2 (figure 4(B)) – this defines the connection strength between any two points as the average of the connectivity measurement (between them) in each direction. Reordering this matrix with Ncut reveals structure in the raw connectivity data (4(C)). Three clusters are identified and mapped onto the brain (4(D)). The first (blue) includes lateral parietal lobe (putative dorsal stream). The second (yellow) includes inferior temporal lobe (putative ventral stream). The third (red) includes medial occipital lobe (putative V1). Reordering Matrices We start with a symmetric matrix, A, in which element Aij describes the relationship between nodes i and j. We assumethat the nodes A may be arranged into clusters such that the relationships within clusters are strong, but the relationships between clusters are weak, such as in figure 1(a). Here, there is a clear distinction between the red and blue nodes in the matrix. However, we also assume that when the data were acquired, this clustering was not known a priori, hence the (red and blue) nodes in the matrix are ordered in a random fashion (figure 1(b)). (Note that the nodes are ordered in the same way on the vertical and horizontal axes, maintaining the symmetry of the matrix). The goal of a reordering algorithm is to find an ordering of the nodes of the matrix (B) which reveals the structure in the matrix, as in (A). One mechanism for revealing structure in the matrix, is to find an ordering which encourages strongly related nodes to appear near each other in the matrix or equivalently, as can be seen in figure 2, encourages large values in the matrix to appear near the diagonal. To achieve this we search for the node permutation which minimizes the sum of element values multiplied by their squared distance to the diagonal. Where p is the permutation vector, W is the spaceof all possible permutations and N is the size of the matrix. Solving this equation exactly would require a search over N factorial possible permutation vectors, and quickly becomes infeasible as N grows large. However an approximate solution can be achieved with the Ncut algorithm which requires only the computation of a single eigenvector of an NxN matrix. For details, see [5]. Figure 4: (A) Schematic of processing streams in the primate visual system. (B) Log connectivity between every voxel in human occipital and parietal lobes. (C) Reordering the connectivity matrix reveals clusters in the data. (D) Clusters mapped back onto the brain reveal putative visual streams. Discussion We have proposed a method for searching for organisation in diffusion tractography data. In the past, results of diffusion tractography from many seed points have only been considered as isolated results. Here we show that by considering all of the connectivity distributions simultaneously we can find new structure in the data. We propose a computationally efficient matrix reorganising routine which we apply to a diffusion-based connectivity matrix of parietal and temporal lobes in the living human brain. Structure is apparent in the reorganised matrix – specifically, three commonly connected clusters can be seen. These clusters appear to correspond to the ventral and dorsal visual streams and primary visual cortex. The ability to consider diffusion tractography data from many seed voxels simultaneously has a great deal of potential. In poster WE205 we apply the same algorithm to a matrix of correlations between connectivity distributions seeded in medial area 6, revealing two clusters of similarly connected voxels. These clusters correspond well with FMRI-based separation of SMA and preSMA. References [1] Basser et al MRM 2000, [2] Catani et al, Neuroimage 2003, [3] Behrens et al. MRM 2003, [3] Behrens et al. Nat Neuro 2003, [4] Johansen-Berg et al. Cereb Ctx in press,[5] Higham, J Comp App Math 2003. Acknowledgements. UK MRC (PMM, SMS, ES), UK EPSRC (TEJB, SMS), Wellcome Trust (HJB), the EPSRC-MRC IRC “From medical images and signals to clinical information” (JMB, MWW).