Download

1 / 1
10 likes | 184 Vues
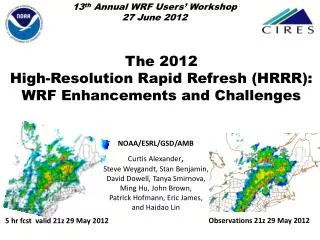
A Prototype Implementation of the High Resolution Rapid Refresh for the Alaska Region. Don Morton, Arctic Region Supercomputing Center, University of Alaska Fairbanks Carl Dierking , NOAA National Weather Service, Juneau Forecast Office

E N D
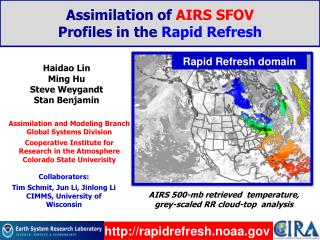
A Prototype Implementation of the High Resolution Rapid Refresh for the Alaska Region Don Morton, Arctic Region Supercomputing Center, University of Alaska Fairbanks Carl Dierking, NOAA National Weather Service, Juneau Forecast Office Eugene Petrescu, NOAA National Weather Service, Alaska Region Introduction Station Analyses The HRRR-AK is an evolving Alaska-centered adaptation of the FULL CONUS High Resolution Rapid Refresh (HRRR) run at NOAA/ESRL/GSD. At 3km resolution, this 56 million grid poing model is run four times per day for 24-hour forecasts, consuming 2.2 million cpu-hours per year at the University of Alaska’s Arctic Region Supercomputing Center. The HRRR-AK is initialized by the highly-assimilated Rapid Refresh (RR), also run at ESRL/GSD, and utilizes the 11km Alaska NAM to extend lateral boundary conditions beyond the RR forecast period. Methods The following time series compare model forecasts with observations at select stations. The plots on the left illustrate model performance when initializing directly from a recent RR run, with no data assimilation. The plots on the right illustrate model performance when using a cycling method to update the HRRR-AK with observations every six forecast hours. Observations • Choose arbitrary 24-hour period with at least mildly interesting weather, for which HRRR-AK forecasts are available • Use the 00Z 24-hour HRRR-AK forecast as a control (00Z_Control) • Four cycling test cases, each initializing off of the previous forecasts FH06, with new observations assimilated – 00Z_ColdStart, 06Z_WarmStart, 12Z_WarmStart, 18Z_WarmStart • Other HRRR-AK forecasts for comparing with RR-initialized runs – 06Z_Control, 12Z_Control, 18Z_Control • Analysis • 2D “diff” plots to gain initial insight • Time series of overall forecast versus observation errors • Time series of forecast and observations for select stations • Understand the processes involved in cold and warm start cycling of the HRRR-AK • Gain an initial feel for the effects of GSI data assimilation on the HRRR-AK. Begin to understand strengths and weaknesses of • Directly initializing forecasts from earlier RR forecasts • Assimilating observations into the RR-initialization • Initializing forecasts not directly from RR, but from an earlier HRRR-AK forecast, assimilated with observations Obtained GDAS prepbufr files for the 24-hour period from NOMADS. Barrow 2m T (deg C) 05/00Z 05/06Z 05/12Z 05/18Z 2D “Exploratory” Plots Deadhorse 2m Td (deg C) The following plots all depict the differences between test runs and the original 00Z_Control run at the final forecast hour of 2010-09-06_00Z. These were used to find “interesting” features for deeper analysis. 1050x1050x51 grid point HRRR-AK domain 13km Rapid Refresh (RR), used for initialization 00Z_ColdStart 06Z_WarmStart 12Z_WarmStart 18Z_WarmStart GRIB2 products are disseminated and used experimentally by Alaska Region forecast offices, and web products are available at weather.arsc.edu. With a quasi-operational system in place, attention is now turning towards making the model more HRRR-like, and tuning it for Alaska-specific needs. A major question that has arisen is whether the HRRR-AK should be initialized directly from the RR (as the CONUS HRRR is), or if data assimilation over the 3km domain should be considered. And, if data assimilation is employed, should we consider cycling the forecasts – initializing each forecast from a prior HRRR-AK forecast, and then assimilating observations – or should we simply assimilate observations into an RR-derived initialization? The work described here represents an “academic” exercise in working through the processes and gaining some initial insight. Test Case Annette Island Precip (mm) T Qv UV mdBZ 24-hour period beginning 2010-09-05_00Z. Interesting features include sustained stationary front along Beaufort coast, trough in northern Gulf of Alaska evolving into a closed Low and occluded front smashing into the panhandle, and close Lows off west coast, evolving into strong system that heads down towards Aleutians. Skagway 2m T (deg C) Goals of Study • Familiarization with the use of Gridpoint Statistical Interpolation (GSI) • Understand the processes involved in cold and warm start cycling of the HRRR-AK • Gain an initial feel for the effects of GSI data assimilation on the HRRR-AK. Begin to understand strengths and weaknesses of • Directly initializing forecasts from earlier RR forecasts • Assimilating observations into the RR-initialization • Initializing forecasts not directly from RR, but from an earlier HRRR-AK forecast, assimilated with observations Summary This study has been intended as an initial academic exercise in working with GSI to apply various forms of initialization to the HRRR-AK forecast in a single 24-hour period. In the station plots for this single exercise, it often appears that a direct initialization from a recent RR run produces better results than does cycling through a single initialization and periodically assimilating new observations. Both the Barrow 2-meter T and the Deadhorse 2-meter Td plots suggest that with a cycling approach from a single RR initialization, we never quite get rid of initial tendencies shown in the control run. However, by directly initializing with more recent RR runs, we may be taking advantage of new highly-assimilated input to erase trends from the initial control run. The Annette Island Precip plot shows a tendency in the control run for continuous precipitation, as do the cycling runs. However, the direct RR initializations seem to better reflect the intermittent nature of the precipitation. In other areas, however, as represented by the Skagway 2-meter T plots, the direct RR initializations start off quite low, maintaining temperatures in the runs that are low, whereas the cycling runs tend to maintain a good initialization. Areas in which this trend are exhibited appear to have rugged topography, and it has been suggested that in these areas the RR has a harder time initializing correctly, whereas assimilating valid observations into an already spun-up cycling model might prove advantageous. 05/00Z and 06/00Z surface analyses (courtesy Anchorage Forecast Office)