A High-Resolution
A High-Resolution. Arctic System Reanalysis. David H. Bromwich 1,2 and Keith M. Hines 1 1 Polar Meteorology Group Byrd Polar Research Center The Ohio State University Columbus, Ohio, USA 2 Atmospheric Sciences Program Department of Geography The Ohio State University Columbus, Ohio, USA.


A High-Resolution
E N D
Presentation Transcript
A High-Resolution Arctic System Reanalysis David H. Bromwich1,2 and Keith M. Hines1 1Polar Meteorology Group Byrd Polar Research Center The Ohio State University Columbus, Ohio, USA 2Atmospheric Sciences Program Department of Geography The Ohio State University Columbus, Ohio, USA
Arctic System Reanalysis (ASR) • Rapid climate change appears to be happening in the Arctic. A more comprehensive picture of the coupled atmosphere/land surface/ ocean interactions is needed. • 2. Global reanalyses encounter many problems at high latitudes. The ASR would use the best available description for Arctic processes and would enhance the existing database of Arctic observations. The ASR will be produced at improved temporal resolution and much higher spatial resolution. • 3. The ASR would provide fields for which direct observation are sparse or problematic (precipitation, radiation, cloud, ...) at higher resolution than from existing reanalyses. • 4. The system-oriented approachwould provide a community focus including the atmosphere, land surface and sea ice communities. • 5. The ASR would provide aconvenient synthesis of Arctic field programs (SHEBA, LAII/ATLAS, ARM, ...)
ASR Outline A physically-consistent integration of Arctic data enhanced observations of the Sustained Arctic Observing Network (SAON) Participants: Ohio State University - Byrd Polar Research Center (BPRC) - and Ohio Supercomputer Center (OSC) National Center Atmospheric Research (NCAR) University of Colorado University of Illinois University of Alaska Fairbanks High resolution in space (20 km) and time (3 hours) Begin with years 2000-2010 (EOS coverage) Supported by NSF as an IPY project
The storm of 19 October 2004 as depicted by the NCEP/NCAR global reanalysis. Contours represent isobars of sea level pressure at increments of 3 hPa. [from visualization package of NOAA Climate Diagnostics Center] The Figure shows an intense storm depicted in the NCEP/NCAR reanalysis for 19 October 2004. This storm, which led to flooding of downtown Nome, Alaska, has a central pressure of 949 hPa in the reanalysis. The actual central pressure deduced by the National Weather Service was as low as 941 hPa.
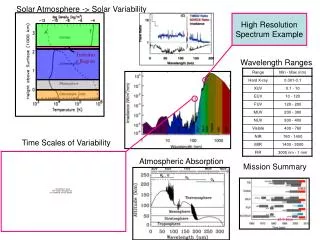
solar and cloud fraction at Barrow (June 2001): ERA40 (red) vs ARM/NSA (black) Radiation and Cloud Differences in the Arctic
Radiation and Cloud Differences in the Arctic longwave and cloud fraction at Barrow (June 2001): ERA40 (red) vs ARM/NSA (black)
New data sources:Important developments in Data AssimilationWRF is well represented • MODIS winds • Tests underway • AIRS • COSMIC • Radio occultation soundings from GPS satellites • ATOVS
Typical distribution of COSMIC GPS radio occultation soundings (green dots) over a 24-hour period over the Arctic.
Mesoscale Modeling High Resolution Depictions
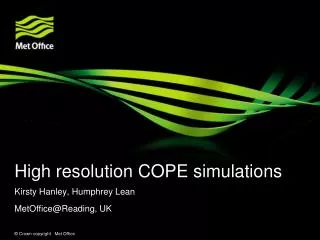
Precipitation over Iceland from Polar MM5 Annual mean precipitation, 1991-2000 derived from polar MM5 V3.5 (cm). Contour interval = 20 cm. MM5 is driven at the boundaries by ECMWF operational analyses. Observed annual mean precipitation (mm) derived from station data, contour interval = 200 mm Importance of high-resolution simulations and skill of numerical models in high latitudes
WRF – Weather Research and Forecasting model • Base model for ASR • Polar WRF – Polar-optimized version has been developed (Ohio State) • Tested for Greenland • Tested for Antarctica • Testing for Sheba • Testing for Arctic land • Data Assimilation (NCAR) • Land surface processes (NCAR)
On the Impact of MODIS Winds on AMPS WRF Forecasts Jordan G. Powers, Syed R.H. Rizvi, and Michael G. Duda Mesoscale and Microscale Meteorology Division National Center for Atmospheric Research Boulder, Colorado, USA
MODIS Wind Retrieval Filtering Unfiltered— ALL Filtered— MOD1 0000 UTC 15 May 2004 Init
III. Simulations and Results • WRF Experiments Init:0000 UTC 15 May 2004 – First-guess and BCs: 1 GFS – Standard AMPS data: Sfc repts, AWS, upper-air, ships, buoys, cloud-track winds CTRLNo data assimilation ALL3DVAR w/std AMPS data + all MODIS MODQC3DVAR w/std AMPS data + MODIS FILTER/QC subset EXMOD3DVAR w/std AMPS data only • MM5 Simulation AMPS MM53DVAR w/std AMPS data only
Experiment Results— WRF Sfc Winds2300 UTC 15 May (Hr 23) ms-1 ms-1 34 34 • 25 25 L L L Sfc Winds(ms-1) SLP(hPa) STD MOD1 L CTRL ALL
ASR High Resolution Domain Outer Grid: ~45 km resolution Inner Grid: ~15 km resolution Vertical Grid: ~60 levels Inner Grid includes Arctic river basins