High resolution COPE simulations
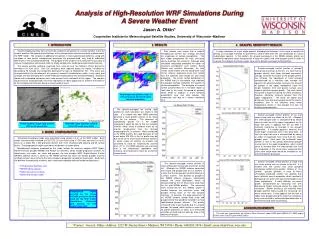
This study focuses on the High-Resolution COPE simulations, conducted by Kirsty Hanley and colleagues, analyzing convective precipitation processes in organized convective systems over Southwest England during July and August 2013. The project aims to deepen the understanding of physical processes involved in convective precipitation, improve the representation of these processes in operational numerical weather prediction (NWP), and enhance data assimilation for better forecasting of convective precipitation events that could lead to flash flooding.

High resolution COPE simulations
E N D
Presentation Transcript
High resolution COPE simulations Kirsty Hanley, Humphrey Lean MetOffice@Reading, UK
COPE • Field campaign to study the production of precipitation in organised convective systems over SW England during July and August 2013
Aims of COPE • Understand the physical processes involved in convective precipitation. • Improve the representation of microphysical processes in operational km-scale NWP. • Improve the exploitation of data used for operational assimilation. • Leading to improved forecast of convective precipitation that can cause flash flooding.
COPE IOPs Sea breeze
Model setup – UM vn8.2 PS32 UKV – 1.5km grid length, 70 levels, 2D subgrid turbulence scheme, BL mixing in vertical. 500m model – 500x400 km 200m model – 300x200 km 100m model – 150x100 km High res models: 140 vertical levels, 3D subgrid turbulence scheme, RHcrit is 0.97 (0.91) in 1st few layers decreasing smoothly to 0.9 (0.8) at ~3.5km. Set of nested models.
Summary 1 • Saw quite high rainrates from warm rain. • Cells appear to get smaller as grid length is reduced – this agrees with work done for DYMECS. • The high resolution models maybe produce too much rain. • Lines appear to break up in 200m and 100m model – why? • Are the cells getting smaller a result of the updrafts getting narrower or is it a micophysics issue? • Look at a sea breeze case without precipitation to isolate vertical velocity.
July 5 – sea breeze convergence FAAM obs Different colours are different times
July 5 – sea breeze convergence 500m UKV Vertical velocity at 325m 13Z 200m 100m Different scale!
July 5 – sea breeze convergence 1000 UKV 0 -0.5 0 0.5 1 1.5 Vertical velocity at 13Z 1000 500m 0 2 -2 0 4 6 1000 200m 0 2 -2 0 4 6 1000 100m 0 -2 0 2 4 6
July 5 – sea breeze convergence 1000 UKV 0 -5 0 5 Westerly wind at 13Z 1000 500m 0 0 -5 5 1000 200m 0 0 -5 5 1000 100m 0 -5 0 5
Summary 2 and Future Work • Updraft magnitude and width compares reasonably well between the observations and the high resolution models – how does cloud width compare? • Compare simulations with lidar and King Air measurements. • Identify key areas of difference between models and observations: • Timing, location, size and intensity of cells.