High-Resolution COPE Simulations and Microphysics Analysis of Convection in Nested Modeling
This report presents detailed findings from high-resolution COPE simulations conducted between July and August 2023. Utilizing the UM vn8.2 PS32 UKV model with grid lengths of 1.5 km down to 100 m, the study examines the impact of these configurations on rainfall rates, convection dynamics, and microphysical processes. Key observations highlight the challenges of excessive precipitation and the behavior of convective cells across different grid resolutions. Future work will focus on analyzing vertical velocities, cloud widths, and comparing simulations with observational datasets.

High-Resolution COPE Simulations and Microphysics Analysis of Convection in Nested Modeling
E N D
Presentation Transcript
High resolution COPE simulations Kirsty Hanley, Humphrey Lean MetOffice@Reading, UK
Model setup – UM vn8.2 PS32 UKV – 1.5km grid length, 70 levels, 2D subgrid turbulence scheme, BL mixing in vertical. 500m model – 500x400 km 200m model – 300x200 km 100m model – 150x100 km High res models: 140 vertical levels, 3D subgrid turbulence scheme, RHcrit is 0.97 (0.91) in 1st few layers decreasing smoothly to 0.9 (0.8) at ~3.5km. Set of nested models.
25 July – line of showers up to 3kmScale-aware microphysics package Scheme includes new autoconversion, subgrid variability of cloud & rain, new drop-size distribution. See Boutle et al 2014, MWR for more details.
25 July – line of showers up to 3kmIan’s microphysics package New package reduces precipitation but lines still break up in 200m and 100m simulations.
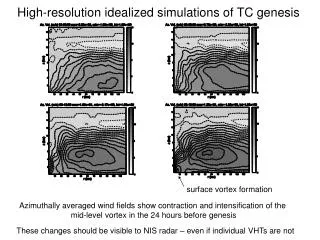
Summary 1 • Saw quite high rainrates from warm rain. • Cells appear to get smaller as grid length is reduced – this agrees with work done for DYMECS. • The high resolution models produce too much rain. • Lines appear to break up in 200m and 100m model – why? • More cases can be seen in the report sent out last Friday. • Are the cells getting smaller a result of the updrafts getting narrower or is it a microphysics issue? • Look at a sea breeze case without precipitation to isolate vertical velocity.
July 5 – sea breeze convergence Vertical velocity at 500m amsl Different scale! Extended 200m and 100m domains by 50km to north
July 5 – sea breeze convergence - Davidstow Lidar data provided by Barbara Brooks
Summary 2 and Future Work • Updraft magnitude and width compares reasonably well between the observations and the high resolution models • How does cloud width compare? • What determines front propagation speed? Roll spacing/depth? • Working with Lindsay, Phil and John N on this case. • Why do high res models break up lines and produce too much precipitation? • Compare simulations with other measurements – FAAM, King Air, Radar, Lidar, surface stations. • Identify key areas of difference between models and observations: • Timing, location, size and intensity of cells. • Cases of particular interest: • 5 July, 18 July, 25 July, 3 August, 15 August
July 5 – sea breeze convergence More low cloud in UKV -> lower surface temperatures -> sea breeze convergence moves slower.