Download
1 / 4
40 likes | 71 Vues
Read More about - A Novel Method for Measuring the Sizes and Concentrations<br>

E N D
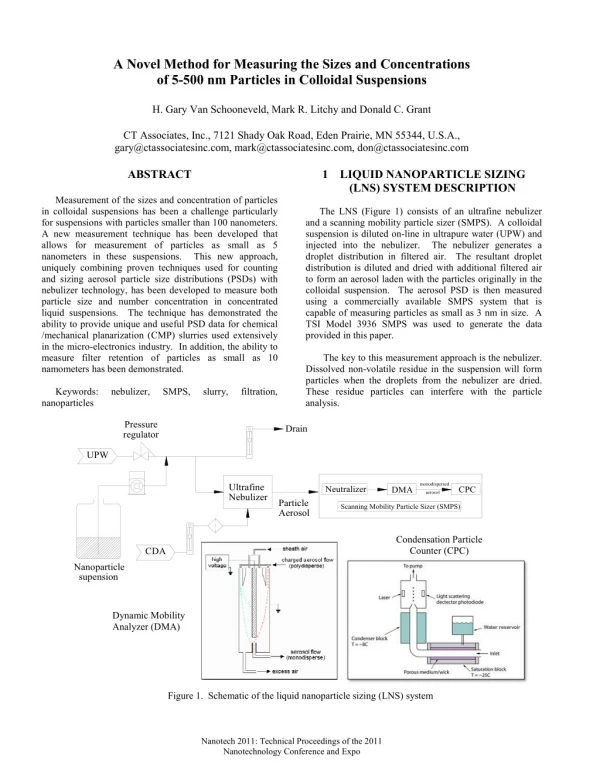
A Novel Method for Measuring the Sizes and Concentrations of 5-500 nm Particles in Colloidal Suspensions H. Gary Van Schooneveld, Mark R. Litchy and Donald C. Grant CT Associates, Inc., 7121 Shady Oak Road, Eden Prairie, MN 55344, U.S.A., gary@ctassociatesinc.com, mark@ctassociatesinc.com, don@ctassociatesinc.com ABSTRACT Measurement of the sizes and concentration of particles in colloidal suspensions has been a challenge particularly for suspensions with particles smaller than 100 nanometers. A new measurement technique has been developed that allows for measurement of particles as small as 5 nanometers in these suspensions. This new approach, uniquely combining proven techniques used for counting and sizing aerosol particle size distributions (PSDs) with nebulizer technology, has been developed to measure both particle size and number concentration in concentrated liquid suspensions. The technique has demonstrated the ability to provide unique and useful PSD data for chemical /mechanical planarization (CMP) slurries used extensively in the micro-electronics industry. In addition, the ability to measure filter retention of particles as small as 10 namometers has been demonstrated. Keywords: nebulizer, SMPS, slurry, filtration, nanoparticles Pressure regulator 1LIQUID NANOPARTICLE SIZING (LNS) SYSTEM DESCRIPTION The LNS (Figure 1) consists of an ultrafine nebulizer and a scanning mobility particle sizer (SMPS). A colloidal suspension is diluted on-line in ultrapure water (UPW) and injected into the nebulizer. The nebulizer generates a droplet distribution in filtered air. The resultant droplet distribution is diluted and dried with additional filtered air to form an aerosol laden with the particles originally in the colloidal suspension. The aerosol PSD is then measured using a commercially available SMPS system that is capable of measuring particles as small as 3 nm in size. A TSI Model 3936 SMPS was used to generate the data provided in this paper. The key to this measurement approach is the nebulizer. Dissolved non-volatile residue in the suspension will form particles when the droplets from the nebulizer are dried. These residue particles can interfere with the particle analysis. Drain UPW monodispersed Ultrafine Nebulizer Neutralizer CPC DMA aerosol Particle Aerosol Scanning Mobility Particle Sizer (SMPS) Condensation Particle Counter (CPC) CDA Nanoparticle supension Dynamic Mobility Analyzer (DMA) Figure 1. Schematic of the liquid nanoparticle sizing (LNS) system Nanotech 2011: Technical Proceedings of the 2011 Nanotechnology Conference and Expo
The nebulizer used in this system minimizes this effect by producing droplets that are sufficiently small and uniformly sized that particles formed from dissolved materials in the droplets are small enough as to not interfere with the particle size measurement. In addition, the particle suspension is sufficiently dilute that no more than one particle is present in each droplet. Also, measuring under different operating conditions, the instrument is capable of determining whether particles measured are from initially dissolved or particle residue. The LNS technique of measuring colloidal PSDs offers many interesting capabilities. This technique measures number concentrations, not relative particle concentrations (that is, one size relative to another) and makes no assumption regarding the shape of the PSD. The number- weighted PSD measured may easily be converted to alternative weightings such diameter (D), surface area (D2), or volume (D3) weighted distributions. Since this technique measures individual particles, it is highly sensitive to measuring rather small changes in these suspensions and is not affected by the optical properties and density of the particles. Finally, the SMPS used to size and count the particles is a well establish instrument for measuring aerosols [1] and is even used to size NIST particle standards [2]. 2SIZING ACCURACY An example of the sizing accuracy of the LNS system is shown in Figure 2. In this evaluation, particles of three gold colloids (BBI Research, Madison, WI) were measured individually. As seen in Table 1, the sizing measurements correlate well with the manufacturer’s sizing claims. Measurements of polystyrene latex (PSL) and silica particles have also shown good agreement with manufacturer’s claims [3]. Manufacturer measured size LNS measured size Nominal Size (nm) Mean (nm) 9.3 CV (%) < 15 Mean (nm) 8.4 CV (%) 13 10 20 20.3 < 8 20.8 7.4 30 30.3 < 8 30.5 7.3 Table 1. Sizing comparison between BBI certificate of analysis and LNS measurments 3MEASUREMENT OF POLISHING SLURRIES The PSD of a tri-modal polishing slurry measured by the LNS is presented in Figure 3. As discussed previously, the LNS directly measures the sizes and numbers of individual particles in the colloidal suspension. As such, variations in concentration of specific size particles amongst samples can readily be detected. Variations in particle concentration can effect process efficacy (e.g. effect material removal rates during polishing). In comparison, Figure 4 presents the data from a DLS instrument used to measure the the same polishing slurry. The DLS is an ensemble measurement technique that measures the properties of many particles simultaneously and then fits the data to an assumed lognormal PSD. In addition, only relative particle concentrations are provided. Scanning electron microscopy (SEM) of the slurry confirms the tri-modal PSD (Figure 5). 2e+16 2e+16 Differential volume concentration 2e+16 d (nm3/mL) / d log (DP) 1e+16 1e+16 1e+16 8e+15 Relative differential concentration 10 nm 20 nm 30 nm 6e+15 d (#/mL) / d log (DP) 4e+15 2e+15 0 10 20 30 40 50 60 70 80 90 100 Particle diameter (nm) Figure 3. Measurement of a tri-modal polishing slurry by the LNS system 5 6 7 8 9 10 15 20 25 30 35 40 Particle diameter (nm) Figure 2. Measurement of BBI gold nanoparticles Nanotech 2011: Technical Proceedings of the 2011 Nanotechnology Conference and Expo
Number-weighted concentrations 8e+10 Number of passes through the pump 1.00 Differential number concentration 0 10 20 50 100 197 508 1013 3217 6e+10 d (#/ml) / d log (DP) 0.75 Relative concentration 4e+10 0.50 2e+10 0.25 0 20 30 40 50 60 70 80 90 100 150 200 300 400 Particle diameter (nm) 0.00 10 20 30 40 50 60 70 80 90 100 Particle diameter (nm) Volume-weighted concentrations 1.2e+17 Figure 4. Measurement of a tri-modal polishing slurry by a DLS system Number of passes through the pump Differential volume concentration 1.0e+17 0 10 20 50 100 197 508 1013 3217 d (nm3/ml) / d log (DP) 8.0e+16 6.0e+16 4.0e+16 2.0e+16 0.0 20 30 40 50 60 70 80 90 100 150 200 300 400 Particle diameter (nm) Figure 6. Example of PSD changes during circulation of a colloidal silica slurry. 4MEASUREMENT OF FILTER RETENTION BELOW 50 NANOMETERS Figure 5. Measurement of a tri-modal polishing slurry by an SEM The removal of particles from liquids by filters used in semiconductor processes has traditionally been performed using optical particle counters. Improvements in these instruments now allow for measurement of particles as small as 40 nm. However, critical feature size for current state-of-the-art devices are currently at 40 nm resulting in a critical particle size of 20 nm. The LNS system has the ability to measure filter retention efficiency well below the critical particle size. In addition, since the sizing accuracy of the LNS is independent of the optical properties of the particle, multiple types of particles can be used as a filter challenge. Historically, most retention testing has been conducted using PSL, particles which have a high refractive index relative to water. In addition, most optical particle counters are calibrated using PSL. PSL is not typically found in high purity water and chemical systems so the ability to use more realistic and relevant particles such as silica is a benefit. An experiment was performed to assess the capabililites of the LNS to measure retention of silica It has been well established that handling slurry (i.e. circulating through a distribution system) can result in changes in the particle size distribution and agglomeration of slurry particles [4]. The ability to measure the change in the “working particle size distribution” is benefical to the CMP engineer seeking tighter process control and improved removal efficacy. Figure 6 shows the cumulative effect of circulating a batch of slurry containing colloidal silica particles. As the number of turn-overs (passes through the pumping system) increased, the concentration of small particles decreased (top graph) and the number of large particles increased (bottom graph). This suggests that this slurry is susceptible to handling damage with small particle agglomerating to form larger particles. Nanotech 2011: Technical Proceedings of the 2011 Nanotechnology Conference and Expo
particles by four different filters. The filters were challenged with mono-dispersed silica particles having a median diameter of 28 nm. Prior to the particle challenge the filters were flushed with UPW to eliminate particle shedding. Four challenge particle concentrations were used ranging from 3x10⁷/mL to 1x10⁹/mL (0.7 to 23 ppb). Particle concentrations upstream and downstream of the filter were measured using the LNS. Filter particle retention was measured as a function of loading (Figure 7). SUMMARY A liquid nanoparticle sizing (LNS) system capable of measuring the sizes and concentrations of particles in colloidal suspension has been developed. The method directly measures particle concentrations and can detect particle sizes down to 5 nm. The system allows measurement of small differences in particle size distributions in colloidal suspensions and measurment of filter retention of particles as small as 10 nm. REFERENCES [1] Wang SC and RC Flagan, “Scanning Electrical Mobility Spectrometer,” Division of Engineering and Applied Science, California Institute of Technology, Pasadena, CA 91125, pp. 138-178, 1989. [2] Donnelly, MK and Mulholland, “Particle size Measurement for Spheres with Diameters of 50 to 400 nm”, National Institute of Standards and Technology, Report # NISTIR 6935, 2003. [3] Grant, DC, “Measurement of 28 nm particle removal from liquids by high purity filters”, North American Membrane Society 2010 Conference, Washington, DC, 2010. [4] Litchy MR and DC Grant. “Effect of Pump Type on the health of various CMP slurries”, Semiconductor Fabtech, 33rd edition, pp 53-59, 2007. 100 90 80 70 Retention (%) 60 Filter E Filter F Filter G Filter H 50 40 30 20 10 3E7/mL 1E8/mL 3E8/mL 1E9/mL 0 0.01 0.1 1 10 Total challenge (monolayers) Figure 7. Retention of 28 nm silica by four filters The vertical axis in Figure 7 is % retention defined as: % Retention = ----------- x 100 where Cin = particle concentration pre-filter Cout= particle concentration post-filter The horizontal axis represents the cumulative particle challenge plotted in monolayers. One monolayer equals the number of particles theoretically require to cover the entire area of the filter based on the particle’s circular cross-section. The vertical dashed lines indicate the change to a new challenge concentration. While Figure 7 indicates significant differences between the retention capabilities the four filters tested. Filter H retention dropped quickly with loading to the point where it was passing almost 100% of the challenge particles near the end of the test. Filter E retained almost 100% of the challenge particles throughout the entire test. Filter F had close to 100% retention until challenged at the highest concentration. Cin - Cout Cin Nanotech 2011: Technical Proceedings of the 2011 Nanotechnology Conference and Expo