Download
1 / 30
310 likes | 419 Vues
Dynamic Energy Budgets i.r.t. population effects of toxicants. Tjalling Jager Dept. Theoretical Biology. Contents. What DEB is not … What is DEB? Advantages of using DEB. Example life-cycle dataset Bindesb ø l et al (2007) copper in Dendrobaena octaedra

E N D
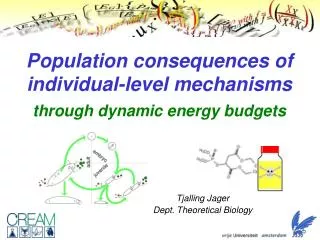
Dynamic Energy Budgetsi.r.t. population effects of toxicants Tjalling Jager Dept. Theoretical Biology
Contents • What DEB is not … • What is DEB? • Advantages of using DEB Example life-cycle dataset Bindesbøl et al (2007) • copper in Dendrobaena octaedra • size, survival, cocoons over 20 weeks • here, only [Cu] > 80 mg/kg
What DEB is not • DEB is not a population model • DEB is not needed to estimate population effects
80 120 160 200 1 2 DEB-less analysis 40 1 35 30 0.8 25 0.6 fraction survival cumulative reproduction 20 hatching time: 92 days 0.4 15 10 0.2 5 0 0 0 50 100 150 0 50 100 150 time (days) time (days)
80 120 160 200 DEB-less analysis 40 1 35 30 0.8 25 0.6 fraction survival cumulative reproduction 20 hatching time: 92 days 0.4 15 10 0.2 5 0 0 0 50 100 150 0 50 100 150 time (days) time (days)
2-stage model splined, Euler-Lotka 1 2 Intrinsic rate of increase 0.025 0.02 0.015 population growth rate (d-1) 0.01 0.005 0 60 80 100 120 140 160 180 200 concentration (mg/kg soil)
What have we achieved? • Integrated effects on survival and reproduction over time … • … for test concentrations and test conditions … • Can we make educated inter- and extrapolations? • longer exposure time, • untested concentrations, • time-varying conditions, • temperature, • food limitation, • other species, • other compounds …
Kooijman (in press) What is DEB? Quantitative theory; ‘first principles’ • time, energy and mass balance Life-cycle of the individual • links levels of organisation: molecule ecosystems Comparison of species • body-size scaling relationships; e.g., metabolic rate Fundamental to biology; many practical applications • (bio)production, (eco)toxicity, climate change, … Kooijman (2000)
feeding reproduction maturation maintenance growth Bookkeeping rules …
internal concentration in time external concentration (in time) life-history traits Toxicants in DEB one-compartment model, accounting for changes in body size toxico- kinetics
internal concentration in time DEB parameters in time external concentration (in time) Toxicants in DEB ingestion rate maintenance rate coeff. egg costs etc. … toxico- kinetics life-history traits
internal concentration in time DEB parameters in time external concentration (in time) Toxicants in DEB KM-DEB (Klok et al, 1996) DEBtox (Kooijman & Bedaux, 1996) DEB3 (Jager et al, subm.) toxico- kinetics DEB model life-history traits
internal concentration in time DEB parameters in time external concentration (in time) Toxicants in DEB growth, time to reproduction, reproduction rate mortality etc. … toxico- kinetics DEB model life-history traits
DEB analysis of data Simultaneous fit size and repro data MoA: decrease in ingestion rate 9 40 80 80 8 35 120 120 160 7 30 160 200 200 6 25 cumulative offspring per female 5 body length 20 4 15 3 10 2 5 1 0 0 50 100 150 0 50 100 150 time (days) time (days)
40 9 35 8 30 7 25 6 cumulative offspring per female 20 5 body length 15 4 10 3 5 2 0 0 50 100 150 1 time (days) 0 50 100 150 time (days) DEB analysis of data Assume size-dependent feeding limitation (Jager et al, 2005) 80 80 120 120 160 160 200 200
internal concentration in time metabolic processes in time external concentration (in time) Parameter estimates TK pars tox pars DEB pars toxico- kinetics DEB model life-history traits to population model …
no-effects DEB, Euler-Lotka Population effects 2-stage model 0.025 splined, Euler-Lotka 0.02 0.015 population growth rate (d-1) 0.01 0.005 0 60 80 100 120 140 160 180 200 concentration (mg/kg soil)
What’s different? model parameters extrapolated parameters DEB effects data individuals population consequences DEB-less
internal concentration in time metabolic processes in time external concentration (in time) Educated extrapolation TK pars tox pars DEB pars toxico- kinetics DEB model life-history traits time-varying concentrations
internal concentration in time metabolic processes in time external concentration (in time) Educated extrapolation TK pars tox pars DEB pars toxico- kinetics DEB model life-history traits less food in environment
Food limitation 0.025 0.02 food 100% 0.015 population growth rate (d-1) 0.01 food 90% 0.005 0 60 80 100 120 140 160 180 200 concentration (mg/kg soil)
internal concentration in time metabolic processes in time external concentration (in time) Educated extrapolation TK pars tox pars DEB pars toxico- kinetics DEB model life-history traits size-dependent feeding limitations
40 9 35 8 30 7 25 6 cumulative offspring per female 20 5 body length 15 4 10 3 5 2 0 0 50 100 150 1 time (days) 0 50 100 150 time (days) Food limitation juveniles 80 80 120 120 160 160 200 200
0.025 0.02 0.015 population growth rate (d-1) 0.01 0.005 0 60 80 100 120 140 160 180 200 concentration (mg/kg soil) Food limitation juveniles food 100% food 90%
internal concentration in time metabolic processes in time external concentration (in time) Educated extrapolation TK pars tox pars DEB pars toxico- kinetics DEB model life-history traits other compounds (related)
internal concentration in time internal concentration in time metabolic processes in time external concentration (in time) external concentration (in time) toxico- kinetics Educated extrapolation TK pars tox pars DEB pars toxico- kinetics DEB model life-history traits other compounds (mixtures)
internal concentration in time metabolic processes in time external concentration (in time) Educated extrapolation TK pars tox pars DEB pars toxico- kinetics DEB model life-history traits other (related) species
What’s the use of DEB? • In-depth interpretation of effects on individual • all endpoints over time in one framework • indicates experimental ‘problems’ • mechanism of action of compound • DEB is essential for inter- and extrapolation • e.g., extrapolation to field conditions • ‘repair’ experimental artefacts • Natural link with different population approaches • simple (e.g., Euler-Lotka and matrix models) • more complex (e.g., IBM’s)
But … • Strong (but explicit) assumptions are made • on metabolic organisation • on mechanisms of toxicity • Elaborate DEB models require strong data • growth, repro and survival over (partial) life cycle • e.g., Daphnia repro protocol extended with size • Almost every analysis raises more questions • difficult to perform on routine basis Interesting point raised by DEB3 … • hatching time and hatchling size can be affected by stress
Advertisement Vacancies • PhD student, Marie Curie training network (CREAM) Courses • International DEB Tele Course 2011 Symposia • 2nd International DEB Symposium 2011 in Lisbon More information: http://www.bio.vu.nl/thb