Download
1 / 34
390 likes | 676 Vues
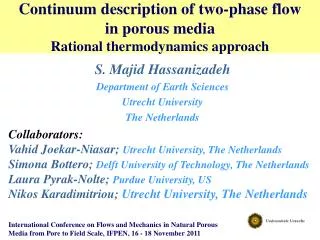
Continuum description of two-phase flow in porous media Rational thermodynamics approach. S. Majid Hassanizadeh Department of Earth Sciences Utrecht University The Netherlands Collaborators: Vahid Joekar-Niasar; Utrecht University, The Netherlands

E N D
Continuum description of two-phase flow in porous media Rational thermodynamics approach S. Majid Hassanizadeh Department of Earth Sciences Utrecht University The Netherlands Collaborators: Vahid Joekar-Niasar; Utrecht University, The Netherlands SimonaBottero; Delft University of Technology, The Netherlands Laura Pyrak-Nolte; Purdue University, US Nikos Karadimitriou; Utrecht University, The Netherlands International Conference on Flows and Mechanics in Natural Porous Media from Pore to Field Scale, IFPEN, 16 - 18 November 2011
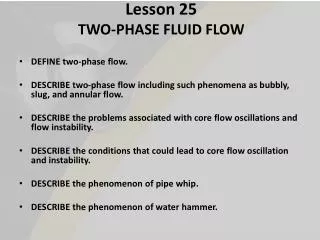
Outline • Continuum description of two-phase flow:From molecular to core scaleWhat is the difference with current theory? • Experimental and computational evidence in support of the rational thermodynamic theory:Capillary pressure hysteresisNon-equilibrium capillarity effectOn the merit of relative permeability
Molecular picture of an interface What is an interface? At molecular scale, an interface is a 3-dimensional transition zone. It is where molecules of both phases “see” each other. For molecular dynamics simulations, one must model interfacial region.
Pore-scale picture of an interface At the continuum (pore) scale, we see a sharp surface. Gibbs concept of interface with excess mass and other excess properties For pore-scale simulations, one must model interfaces explicitly.
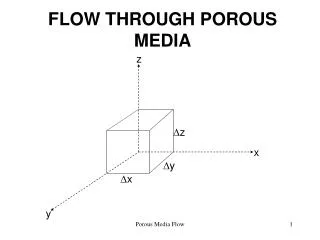
Core-scale representation of a porous medium Representative Elementary Volume (REV) Murdoch and Hassanizadeh, 2002
Core-scale representation of a porous medium Define macro-scale mass densities and velocities For a phase: For an interface: Murdoch and Hassanizadeh, 2002
Core-scale description of a porous medium Upscaling from molecular to core scale yields conservation laws: Murdoch and Hassanizadeh, 2002
Core-scale description of a porous medium • Principles of rational thermodynamics: • Balance laws • Entropy inequality • Constitutive equations for quantities such as stress tensor, heat vector, exchange terms, internal energy • State variables:mass density of phasesmass density of interfacesporositysaturationspecific interfacial areatemperature Murdoch and Hassanizadeh, 2002
Application of Rational Thermodynamics yields: Extended Darcy’s law (linearized equation of motion ): where Gα is the Gibbs free energy of a phase: Linearized equation of motion for interfaces : where Gwn is the Gibbs free energy of wn-interface: Hassanizadeh and Gray, 1990
Extended theories of two-phase flow Extended Darcy’s law : where Gα is the Gibbs free energy of a phase: Extended Darcy’s law : where are material coefficients. Hassanizadeh and Gray, 1990
Extended theories of two-phase flow Linearized equation of motion for interfaces: where Gwn is the Gibbs free energy of wn-interface: Simplified equation of motion for interfaces (neglecting gravity term): where is a material coefficient and is macroscale surface tension. Hassanizadeh and Gray, 1990
Summary of extended two-phase flow equations Hassanizadeh and Gray, 1990
Drainage Imbibition Capillary pressure head, Pc/g Capillary pressure head, Pc/g Water content Water content CAPILLARY PRESSURE-SATURATION DATA POINTS MEASURED IN LABORATORY
A new generation of micro-model experiments A micro-model (made of PDMS) with a length of 35 mm and width of 5 mm; It has 3000 pore bodies and 9000 pore throats with a mean pore size of 70 μm and constant depth of 70 μm
A new generation of micro-model experiments Micromodel experimental setup
Visualization of interfaces in a micromodel Drainage Imbibition Sn= 24% Pc = 4340 Pa Awn = 18.32 mm2 Sn= 24% Pc = 2200 Pa Awn = 30.56 mm2
Drainage Imbibition Capillary pressure head, Pc/g Capillary pressure head, Pc/g Water content Water content CAPILLARY PRESSURE-SATURATION DATA POINTS MEASURED IN LABORATORY
Macroscale capillarity theory Imbibition Drainage Results of pore-network modelling, Held and Celia, 2001
(a) (b) Measuring awn interfaces in a micromodel Drainage Imbibition J.-T. Cheng, L. J. Pyrak-Nolte, D. D. Nolte and N. J. Giordano, Geophysical Research Letters, 2004
Comparison of Drainage & Imbibition Surfaces J.-T. Cheng, L. J. Pyrak-Nolte, D. D. Nolte and N. J. Giordano, Geophysical Research Letters, 2004 Mean Relative Difference: -3.7% Standard Deviation: 10.6% Similar results have been obtained by pore-network modellingby Joekar-Niasar and Hassanizadeh, 2010
Experimental studies of dynamic capillarity effect Air chamber PPT NW back PPT W front PCE reservoir Soil sample Water Hassanizadeh, Oung, Manthey, 2004
Measurement of “Dynamic Pressure Difference” Curves Hassanizadeh et al., 2004
10.0 prim drain PN~16kPa prim drain PN~20kPa prim drain PN~25kPa Dyn.P.D. main imb PW~0kPa 8.0 main imb PW~5kPa main imb PW~8kPa Dyn.M.D. main imb PW~10kPa main imb PW~0kPa last S.P.D. 6.0 main drain PN~16kPa main drain PN~20kPa S.M.D. main drain PN~25kPa main drain PN~30kPa S.M.I. 4.0 Static Pc inside 2.0 Dyn.M.I. 0 -2.0 0 0.20 0.40 0.60 0.80 1.00 Two-phase flow dynamic experiments (PCE and Water) Pn-Pw (kPa) Saturation, S
Experimental studies of two-phase flow theories Brass filter PCE Pressure Regulator PPT3 NW-W Water TDR3 Air PPT2 NW-W TDR2 Equilibrium Pc-Sw curves Primary drainage Main drainage Main imbibition Non-equilibrium drainage with large injection pressure PPT1 NW-W TDR1 Switch on/off Water Pump Pressure transducer Differential pressure Water Pump Differential pressure gauge PCE Pump Switch on/off PCE Pump Bottero and Hassanizadeh, 2010 Valves
Non-equilibrium primary drainage;(Non-eq.) pressure difference vs saturation at position z1 Pressure difference (kPa)
Value of the damping coefficient as a function of saturation Local scale Sw (105 Pa.s) Column scale Sw (106 Pa.s)
Non-equilibrium primary drainage;Local pressure difference vs time; Injection pressure, 35kPa Phases Pressure difference (kPa)
Extended Darcy’s law The relative permeability is not the kind of coefficient it is promised to be: a linearity coefficient.
Long Dynamic Pore-Network Models Joekar-Niasar and Hassanizadeh, 2010
Steady-state permeability curves Total permeability as a function of saturation for a range of capillary numbers
Transient permeability curves Total permeability as a function of saturation for a range of capillary numbers
simulating two-phase flow in a long domain Material coefficients as functions of Sw for a wide range of capillary numbers
simulating two-phase flow in a long domain Material coefficients as functions of Sw for a wide range of capillary numbers
CONCLUSIONS: Include Fluid-Fluid Specific Interfacial Area in the macro-scale theories of two-phase flow in porous media