15.1 Venn Diagrams
190 likes | 589 Vues
15.1 Venn Diagrams. OBJ: • To use Venn diagrams to illustrate intersections and unions of sets. When drawing a Venn diagram, a rectangle represents the total items counted. Inside the rectangle are circles representing subsets of that total. A B 1 2 3 4

15.1 Venn Diagrams
E N D
Presentation Transcript
15.1 Venn Diagrams OBJ: •To use Venn diagrams to illustrate intersections and unions of sets
When drawing a Venn diagram, a rectangle represents the total items counted. Inside the rectangle are circles representing subsets of that total. A B 1 234 (Page 1: Venn Diagram#1 On Right)
A∩B 2, 3 2, 3 3, 4 AB 1 234 Section 3 (Venn Diagram#3 on Right) AB 1 234 Shade A ∩ B
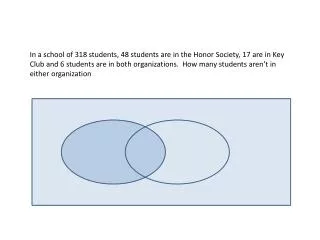
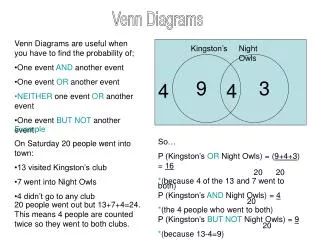
Of 1000 Americans, 450 have the antigen A on the surface of their red blood cells and 140 have the antigen B. (Venn Diagram #2 on Right) *****(40 have both)***** 1000 (450) AB (140) 40 What does this represent? AB This is type ___ blood This is type AB blood 1 234
Shade AU B (Venn Diagram #4 on Right) 2,3 2,3 3,4 2, 3, 4 A B 1 2 34 What does this represent? People that have A or B or both antigen
(Venn Diagram #5 on Right) Shade A∩ B 2, 3 1,2 What does this represent? A B 1 2 3 4 This is type ___ blood This is type Ablood
Of 1000 Americans, 450 have the antigen A on the surface of their red blood cells and 140 have the antigen B. 1000 (450) AB (140) 410
(Front Page 2: Venn Diagram#1 On Right) Shade A ∩ B 1,4, 3,4 What does this represent? 1 2 34 This is type ___ blood This is type B blood
Of 1000 Americans, 450 have the antigen A on the surface of their red blood cells and 140 have the antigen B. 1000 (450) A B (140) 100
(Venn Diagram #2 On Right) Shade A U B 2, 3, 4 = 1 What does this represent? A B 1 2 3 4 This is type ___ blood This is type 0 blood
Of 1000 Americans, 450 have the antigen A on the surface of their red blood cells and 140 have the antigen B. 1000 (450) AB (140) 450
(Venn Diagram #2 On Right) Shade A U B 2, 3, 4 = 1 What does this represent? A B 1 2 3 4 This is type ___ blood This is type 0 blood
(Venn Diagram #3 On Right) Shade A ∩ B 1, 4 1, 4 ∩ 1, 2 A B 1 2 3 4 What equation can be written? A U B = A ∩ B
(Venn Diagram #4 On Right) Shade A ∩B 2, 3 2, 3 ∩ 3, 4 3 = 1, 2, 4 A B 1 2 3 4
(Venn Diagram #5 On Right) Shade A U B 1, 4 1, 4 U 1, 2 1, 2, 4 A B 1 2 3 4 What equation can be written? A ∩ B = A U B
(Back Page 2: Venn Diagram #2 On Right) A ∩ (B U C ) A B 1 2 3 4 6 5 7 8 C 3, 4, 6, 7 U 5, 6, 7, 8 3, 4, 5, 6, 7, 8 2, 3, 5, 6 ∩ 4, 3, 5, 6, 7, 8 2, 3, 5, 6 ∩ 4, 3, 5, 6, 7, 8 3, 5, 6
B U (A ∩ C ) A B 1 2 3 4 6 5 7 8 C 1, 4, 7, 8 ∩ 2, 3, 1,4 1, 4, 7, 8 ∩ 2, 3, 1,4 3, 4, 6,7 U 1, 4 1, 3, 4, 6, 7
A ∩ (B ∩ C ) A B 1 2 3 4 5 6 7 8
A ∩ (B ∩ C ) A B 1 2 3 4 6 5 7 8 C 3, 4, 6, 7 ∩ 5, 6, 7, 8 3, 4, 6, 7 ∩ 5, 6, 7, 8 1, 4, 7, 8 ∩ 6, 7 7