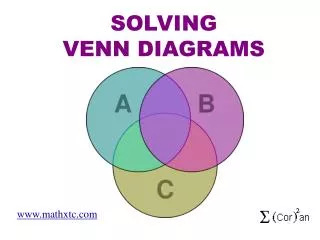
VENN DIAGRAMS
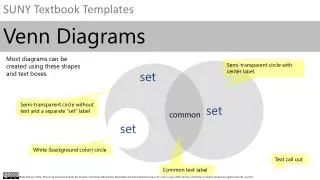
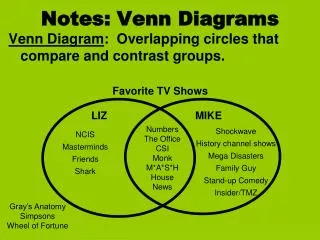
VENN DIAGRAMS. Venn Diagrams. A Venn diagram is a drawing in which sets are represented by geometric figures such as circles and rectangles. Venn diagrams can be used to illustrate the relationships between sets, and the effects of set operations.

VENN DIAGRAMS
E N D
Presentation Transcript
Venn Diagrams A Venn diagram is a drawing in which sets are represented by geometric figures such as circles and rectangles. Venn diagrams can be used to illustrate the relationships between sets, and the effects of set operations. Venn diagrams are also used in other areas of mathematics, such as counting, probability and logic.
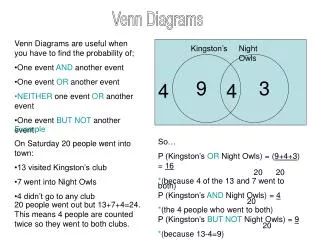
Set operations We will look at three basic set operations Intersection S T = only the member of sets S and T in common Union S T = all the members of both sets S and T Complement S = everything that is not in set S
Venn Diagrams - Intersection Let S, T represent any sets in a universe U. The Venn diagram below illustrates the effect of intersection. The shaded region corresponds to S T.
Venn Diagrams - Union Let S, T represent any sets in a universe U. The Venn diagram below illustrates the effect of union. The shaded region corresponds to S T.
Venn diagrams - Complement Let S, T represent any sets in a universe U. The Venn diagram below illustrates the effect of complement. The shaded region corresponds to S.
Set Information A = {Citizen Kane, Casablanca, The Godfather, Gone With the Wind, Lawrence of Arabia} B= {Casablanca, The Godfather Part 2, The Wizard of Oz, Citizen Kane, To Kill A Mockingbird} C = {Gone With the Wind, Casablanca, West Side Story, An Affair To Remember, Roman Holiday}.
Set operations Form a new set whose elements are those that sets A and B have in common A = {Citizen Kane, Casablanca, The Godfather, Gone With the Wind, Lawrence of Arabia} B= {Casablanca, The Godfather Part 2, The Wizard of Oz, Citizen Kane, To Kill A Mockingbird} {Citizen Kane, Casablanca} This set is called the INTERSECTION of A and B, denoted A B. A B = {Citizen Kane, Casablanca}
Set operations Find B C B= {Casablanca, The Godfather Part 2, The Wizard of Oz, Citizen Kane, To Kill A Mockingbird} C = {Gone With the Wind, Casablanca, West Side Story, An Affair To Remember, Roman Holiday} B C = {Casablanca}
Set operations A different operation: form a new set that contains all the elements of A along with all the elements of B. A = {Citizen Kane, Casablanca, The Godfather, Gone With the Wind, Lawrence of Arabia} B= {Casablanca, The Godfather Part 2, The Wizard of Oz, Citizen Kane, To Kill A Mockingbird} {Citizen Kane, Casablanca, The Godfather, Gone With the Wind, Lawrence of Arabia, The Godfather Part 2, The Wizard of Oz, To Kill A Mockingbird} This set is called the union of A with B, denoted A B.