Download
1 / 20
231 likes | 492 Vues
SUSTAINABLE MICRO-FINANCE for WOMEN’S EMPOWERMENT. USING PARTICIPATORY TOOLS. Participation For Empowerment. P ARTICIPATORY A CTION L EARNING S YSTEM. Sustainable System. Action Learning. PALS = FRIENDS. PURPOSE Awareness raising and training

E N D
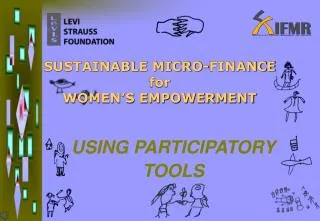
SUSTAINABLE MICRO-FINANCE for WOMEN’S EMPOWERMENT USING PARTICIPATORY TOOLS
Participation For Empowerment PARTICIPATORY ACTION LEARNING SYSTEM Sustainable System Action Learning PALS = FRIENDS
PURPOSE • Awareness raising and training • Participatory action research and planning • Community advocacy and lobbying • Participatory monitoring, evaluation and impact assessment • ISSUES • women’s empowerment • poverty-targeted micro-finance • organizational development • enterprise diversification METHODOLOGY Aims to empower people, particularly the very poor, as individuals and collectively, to collect, analyse and use information to Improve and gain more control over their lives at the micro- and macro-levels DIAGRAM TOOLSRoad JourneysDiamondsTrees Circles CalendarsMatrices WHERE? KRC, Uganda GreenHome, Uganda ANANDI in India, Jamghoria Sevabrata, India LEAP in Sudan Taraqee Foundation Pakistan Kashf Foundation Pakistan PARTICIPATORY PROCESSIndividual, group, collective levels Empowering Enquiry
EMPOWERING ENQUIRY: KEY STEPS • Stakeholder analysis to identify lines of difference, consensus and conflict of interest: Who is to be empowered? What is the role of external agencies and the currently powerful? Who is to be represented in the investigation process? • Then with different key stakeholder groups: • Visioning change: What do people want to be changed? • Appreciating achievements: What positive changes are occurring and how? • Identifying challenges: What negative changes are occurring and what challenges need to be addressed? • Exploring the future: How can positive changes be further increased? How can negative changes be avoided? By whom? • Then bringing together different stakeholder representatives and ensuring that the poorest and most vulnerable are adequately represented and supported: • Negotiating change: How can the different views and potential conflicts of interest be negotiated in practical programme or policy change?
CRYSTALLISATION’ CHECK • ‘What are the precise practical questions and issues which the investigation is designed to address? • Why do we need to know? Who will use the information generated and how? • Are the methodologies, indicators, structures for representation and steps in investigation adequate to address these questions? • Are any of the questions or elements in the investigation redundant? Can they be omitted to decrease time and costs?
EMPOWERMENT CHECK • Does the investigation process really build the capacity, skills and learning of programme participants and increase their understanding? • How is learning linked to action? • Are the most disadvantaged and vulnerable stakeholders adequately represented at all stages?
Empowerment journey Charts the ultimate goal of an individual in relation to empowerment showing different stages which that person expects to go through. VisionJourney to the future Charts the ultimate goal of a group, identifies the steps along the way and whether or not the journey is expected to be easy and straight upwards, or up and down. ROADJOURNEYS OPPORTUNITIESAND HOW TO REACH THEM TRACK STEPS ALONG THE ROAD Achievement Journey from the past Charts a history from its origin, showing the different achievements and steps or interventions which have helped or hindered. Then it identifies lessons for the future. RISKS AND HOW TO AVOID THEM
Empowerment diamond Looks at whether most people consider themselves, or could be considered, powerful, how many people are very powerful or very powerless, what criteria are used and why. EMPOWERMENT DIAMONDS Most empowered Empowered Household equality diamond Looks at concepts of household equality, where the most households are above or below this ideal, the criteria used and the numbers and characteristics of ideal households and very bad households. Less empowered Disempowered/powerless
Peace and relief 6 women – all single, widowed or unmarried Violence happens everyday in form of – verbal abuse, fight over money, daily consumption of alcohol by everyday by men, minor beating fight over “meal not tasty” by husband, slapping etc. is something that they have to learn to live with. Violence Diamond,ANANDI, India Looks at different levels of violence: from ‘acceptable levels of violence’ to extreme, numbers of people and strategies. Woman being beaten up with stick and other sharp weapon, Bleeding, Cloths torn, and cloths ablaze, Liquor bottle in hand the man, kerosene bottle nearby , Bigamy by husband leading to feeling of loneliness/ humiliation/denial followed by physical abuse by husband, Father-in-law and brother -in-law abusing women Woman trying to hang herself- committing suicide Calling woman a witch(dakan) or "childless"(vanziyan) Marriage of 17-18 year old girl with boy barely 12-13yrs. Extreme violence 5 women "Beating till you get wounded (bleeding) and you feel like committing suicide is extreme, unbearable violence"
POVERTY DIAMOND Looks at whether most people are above or below the poverty line as identified by a community, then how many people are very rich or very poor, what criteria are used and why. Can also identify different female and male indicators through putting these on different sides of the diamond.
TREES Trees start from a trunk representing an issue or an institution like a household or community. Inputs are then shown as roots and outputs as branches. These can analyse challenges and solutions, causes and effects, incomes and expenditures, costs and benefits and so on. Both roots and branches can be of different sizes and quantified. They can also be arranged or coloured, grouped and ranked for qualitative analysis. The roots or branches can represent targets which can be quantified and revisited for assessment.
DETAILED LOAN/GRANT USE/ASSESSMENT TREE To plan and track loan or grant use in detail following business vision journey Trunk is the intended economic activity. Roots are the inputs and expenditures differentiated into different types and quantified. Branches are the expected profits and incomes. Some of the branches then have ‘banyan roots’ to go back down as reinvestment and loan repayment flows. All this is quantified and tracked over time as part of a loan or grant agreement or contract. Can either have its own calendar, or provide the basis for detailed filling in of stages on the Road Journey
CHALLENGE/SOLUTION TREE • Has one central challenge as the trunk • Has the causes/sub-challenges grouped, quantified and prioritised as roots • Potential solutions for causes as branches differentiated by things people themselves can do individually, what they can as a group • Necessary outside inputs as beneficial insects which they hope will come along, but which they cannot rely on • These are then tracked over time as ripe, unripe or withered fruits. • Along each branch can be a mini-road journey to set targets to reach the fruits or targets.
CIRCLES • Show the relationships between different elements represented as overlapping circles. Venn or chapatti circles can also be combined with pie charts to quantify each circle. Circles can be of different sizes and types for qualitative and quantitative analysis and re-analysed for changes at a later date. • value chain mapping to show relationships, numbers of people and values in different circle points along the production and marketing chain • market mapping to brainstorm the different potential markets for the same product and/or different products in the same market also marking on the actual or possible prices, numbers of people etc in each market, possible gender discrimination or patterns of exclusion • institutional mapping (including financial landscape mapping) to identify the range of networks and institutions to which people belong, where they have contacts, where they need to influence
EMPOWERMENT/HAPPY FAMILIESDIAMOND • STEP 1:VISIONNING • STEP 2: RANKING • STEP 3: SCORING: BEFORE AND AFTER • STEP 4: PRACTICAL WAYS FORWARD