Download
1 / 13
130 likes | 223 Vues
Explore the effects of CO2 permit prices on energy markets in Nordic countries using modeling techniques. Real-world issues are addressed through simplified models, aiding forecasting and decision-making. Comparison of model results and perspectives on synchronized vs unsynchronized input are discussed.

E N D
Model results and sensitivity analyses connected to the impact of CO2-permit prices on energy markets in the Nordic countries Hans Ravn, RAM-løse edb Tiina Koljonen, VTT Lasse Torgersen, ECON Thomas Engberg Pedersen, COWI Per Erik Springfeldt, EME Analys Thomas Unger, Profu
Why energy systems modeling ? • Real-world problems are very complex. To tackle this • a model • - simplifies the real world into a comprehensive form • - filters the ”noise”, i.e. ”what happens if … given that…” • Increases the understanding of the system-in-focus and improves decision-making Models are also used for direct forecasting (e.g. electricity-price forecasting) Models may act as an objective platform for communication to the participants involved
The NEP models The rest of the macro economy Energy demand The technical energy system (conversion system) Resources MARKAL-NORDIC ECON-Classic VTT-EMM PoMo Balmorel General equilibrium models
The NEP models – Basic features Model Geography Market Investments Balmorel The Baltic Electricity and Generally endogenized (exog in Sea Area distr heating the present analysis) PoMo The Nordic Electricity Exogenous countries (excl Den) ECON-Classic Northern Europe Electricity Exogenous VTT-EMM The Nordic Electricity Exogenous countries MARKAL-NORDIC The Nordic Stationary Endogenized countries energy system
Modeling process of the NEP project • Simple comparison of model results from previous studies • (no syncronization) presented in Stockholm • Simple comparison of model results with syncronized input • presented in Köpenhamn • 3 Modeling of NEP-specific issues (syncronized input)
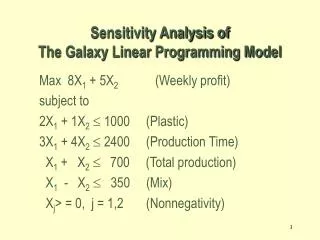
Syncronized • Fuel costs (fossil fuels and biomass) • EUR/MWh 2010 2020 • Gas 17 19 • HFO 22 24 • Coal 5,9 6,0 • Biomass (upper) 19 19 • Swedish ”nuclear phase-out” • Discount rate (7%) • CO2-permit prices 10, 20 and 50 EUR/t • Not syncronized • Technology costs (investments, O&M) and performance • ”Model mathematics” (object. funct, dynamics etc.) • Demand • Potentials • etc
80 70 60 Markal 50 Balmorel 40 PoMo EUR/MWh ECON C 30 VTT-EMM 20 10 0 0 10 20 30 40 50 60 EUR/t 80 70 60 MARKAL 50 Balmorel PoMo EUR/MWh 40 ECON C 30 VTT-EMM 20 10 0 0 20 40 60 EUR/t Syncronized input What about output ? Syncronized model runs (”The Köpenhamn experience”) Non-syncronized model runs (”The Stockholm experience”)
Perspectives Different models, unsynchronized input, give different simulation results: • An opportunity to enhance understanding of what is important with respect to • model functionality • data • To the extent that the models reflect aspects of reality also an opportunity to learn about reality and influence it: • which types of instruments could be applied • how much, when, where, …