The analytical stuff is done . . .
Comprehensive guide on implementing EPA’s Nine Elements of Plans for effective watershed management. Includes tips on task assignment, action implementation, monitoring progress, and securing technical assistance and funding.
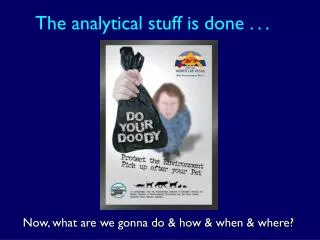

The analytical stuff is done . . .
E N D
Presentation Transcript
The analytical stuff is done . . . Now, what are we gonna do & how & when & where?
Assigning tasks, implementing actions, and monitoring progress 2
EPA’s Nine Elements of Plans • a. Identify causes & sources of pollution • b. Estimate load reductions expected from BMPs • c. Describe mgmt measures & targeted critical areas • d. Estimate technical and financial assistance needed • e. Develop an education component • f. Develop a reasonably expeditious project schedule • g. Describe interim, measurable milestones • h. Identify indicators to measure progress • i. Develop a monitoring component Source: US EPA, 2004 319 Supplemental Guidelines
Asking the right questions . . . • Who can help implement the BMPs or controls? • Agencies, businesses, non-profits, citizens, producers • How can they be implemented? • What has been done in the past? • How well did it work? • Can we do it (or adapt it) here? • When can we get started? • Reasonable short-term actions • Long-term or major actions • How do we know if it’s working? • And what do we do if it’s not?
Estimate technical and financial assistance needed • Funding sources • Grants, contracts, donations • Supplemental Env. Projects • Sources of technical assistance • Internal and external • Design/engineering services • Volunteer & other groups • Regulatory or other authority • Health dept. planning/zoning • WHPP, SWPP, etc. • Matching support sources • Outreach & education support • Be creative!
Develop an education component “An information/education component that will be used to enhance public understanding of the project and encourage their early and continued participation in selecting, designing, and implementing the NPS management measures that will be implemented.” What stage of outreach or education are we at? • Awareness • Education • Action
Developing info/ed activities • Define overall goal and objectives • Identify and characterize target audience • Create message(s) for target audience(s) • Package the messages for distribution • Distribute messages to the audiences • Evaluate the information/education effort 7
Develop a reasonably expeditious project schedule • Who’s going to do something? • What are they going to do? • Where will they do it? • When will they do it? • How will they do it? • Lots of detail for the short term • Less detail for long-term projects
Setting times and targets • Develop implementation schedule • Think about short term (< 2 yrs) and long-term (> 5 yrs) goals • Determine how you will measure success • What indicators are linked to the problems you’re dealing with? • Set interim milestones • What helps to show progress? • Can be both water quality & programmatic indicators
Describe interim, measurable milestones “A description of interim, measurable milestones for determining whether NPS management measures or other control actions are being implemented.”
Example milestones • Short-term (<1 yr) • Achieve 25% reduction in sediment load on 1,000 acres of ag land in the Cross Creek watershed by implementing rotational grazing practices. • Mid-term (1-4 yrs) • Reduce streambank erosion and sediment loading rate by 30% by reestablishing vegetation along 3,600 feet of Cross Creek. • Long-term (>5 yrs) • Restore upper reaches of 6 tributaries and create buffer easements along 15,000 ft of Cross Creek feeder streams.
Identify indicators to measure progress “A set of criteria that can be used to determine whether loading reductions are being achieved over time and substantial progress is being made towards attaining water quality standards and, if not, the criteria for determining whether this watershed-based plan needs to be revised or, if a NPS TMDL has been established, whether the NPS TMDL needs to be revised
Establish indicators & targets for management objectives INDICATOR = measurable parameter used to evaluate relationship between pollutant sources and environmental conditions TARGET = value of indicator that is set as the goal to achieve
Other types of indicators • Environmental Indicators: • # of occurrences of algal blooms • miles of streambank restored or fenced off • % increase in “healthy-stream” critters • Increase in DO • # of waterbodies restored • Administrative/programmatic indicators • # of BMPs installed • # of newspaper stories printed • # of people educated/trained • # of public meetings held • # of volunteers attending activities • # of storm drains stenciled
Develop a monitoring component “A monitoring component to evaluate the effectiveness of the implementation efforts over time, measured against the criteria established under item (h) immediately above.”
What should we monitor? • Indicators that: • Characterize the watershed • Define and/or refine your understanding of the problem(s), such as water quality criteria violations, etc. • Show changes in targeted water quality or habitat conditions • Efficiently provide effective management information
Designing a monitoring program http://www.waterboards.ca.gov/index.html
Monitoring and adaptive management • Interim measurable milestones • Load reduction targets • Monitoring component • Who will help with monitoring? • Measuring your chosen indicators • Develop evaluation framework • Indicator targets vs. collected data
Make Adjustments! • Monitor water quality and BMPs • Compare results to goals • Are you making progress? • Are you meeting your goals? • If you aren’t meeting implementation milestones . . . • If you aren’t making progress toward reducing pollutant loads….
Who will implement the plan? Structure can vary widely • Public agencies • Cities, counties • Water or wastewater utility • State agency or river authority • Basin planning teams • Private entities • Watershed association • Ag producer council Any well-organized single or multiple entity approach can coordinate and document the effort
Coordinate with other water resource and land use programs • Section 303, Water Quality Standards, TMDLs • Section 319, NPS Program • Section 402, NPDES Permits, CAFOs, Stormwater I & II • Source Water Protection Plans – local water utilities • Wetlands Protection Programs • EQIP, CRP, BLM, USFS, USFWS • More…
During implementation, remember: • Plans are guides, not straitjackets • Be aware of unforeseen opportunities • Picking the low-hanging fruit is easy, but it helps to build a sense of progress & momentum • If possible, work quietly for as long as you can on the most contentious issues
The Bottom Line: • Load reduction estimates are critical for point & nonpoint sources • Preliminary info & estimates can be modified & corrected over time • NPS 319 - funded management measures should proceed only after reasonable estimates are made of how far they will go towards achieving water quality targets.


![This Is the [OBVIOUS] Stuff I Care About. This Is the [OBVIOUS] Stuff, the Absence of](https://cdn1.slideserve.com/3318211/slide1-dt.jpg)

![This Is the [OBVIOUS] Stuff I Care About. This Is the [OBVIOUS] Stuff, the Absence of](https://cdn2.slideserve.com/4711239/slide1-dt.jpg)