Download
1 / 18
180 likes | 338 Vues
Lightning Jump Evaluation RITT Presentation Tom Filiaggi (NWS – MDL) 11/28/12. Evaluation of “ 2 σ ” as Predictor for Severe Weather. Agenda. Total Lightning Lightning Mapping Arrays (LMAs) Previous Research Summary Current Project: Goals Current Project: Progress

E N D
Lightning Jump EvaluationRITT PresentationTom Filiaggi (NWS – MDL)11/28/12 Evaluation of “2σ” as Predictor for Severe Weather
Agenda • Total Lightning • Lightning Mapping Arrays (LMAs) • Previous Research Summary • Current Project: Goals • Current Project: Progress • Current Project: Future Work • Related, but Beyond Scope
“Total Lightning” • Most familiar is Cloud-to-ground (CG): • point locations at ground level • Uses certain types of electromagnetic field sensors • Can directly impact more people • Total Lightning: • uses a different kind of sensor to obtain step charge release locations for all flashes (not just CG) • Location is in full 3 dimensions • More difficult to sense with ‘sufficient’ accuracy – need more sensors • Less direct societal impact to people, but can be used indirectly, perhaps with significant value (Image borrowed from http://weather.msfc.nasa.gov/sport/lma/)
Sensors:Lightning Mapping Array • Predominant sensor array type used by this project • Uses time of arrival and multilateration to locate step charges
Sensors:Lightning Mapping Array • NALMA example • Sensor distribution and ‘effective’ domain (Images borrowed from http://weather.msfc.nasa.gov/sport/lma/)
Summary of Previous Research • Goodman et al. (1988) demonstrated that total lightning peaked prior to the onset of a microburst. • Williams et al. (1989) showed that the peak total flash rate correlated with the maximum vertical extent of pulse thunderstorms, and preceded maximum outflow velocity by several minutes. • MacGorman et al. (1989) showed that the total flash rate peaked 5 minutes prior to a tornado touchdown, while the cloud-to-ground (CG) flash rate peaked 15 minutes after the peak in intra cloud flash rate. Adapted from Goodman et al. (1988) Adapted from MacGorman et al. (1989) Slide contents borrowed from Schultz (UofAH)presentation.
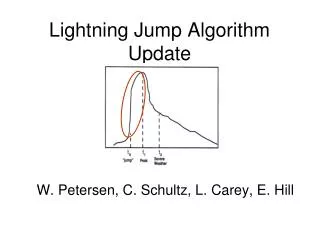
Summary of Previous Research • Williams et al. (1999) examined a large number of severe storms in Central FL • Noticed that the total flash rate “jumped” prior to the onset of severe weather. • Williams also proposed 60 flashes min-1 or greater for separation between severe and non-severe thunderstorms. Slide contents borrowed from Schultz (UofAH) presentation. Adapted from Williams et al. (1999) (above)
Summary of Previous Research • Gatlin and Goodman (2010) , JTECH; developed the first lightning jump algorithm • Study proved that it was indeed possible to develop an operational algorithm for severe weather detection • Mainly studied severe thunderstorms • Only 1 non severe storm in a sample of 26 storms Adapted from Gatlin and Goodman (2010) Slide contents borrowed from Schultz (UofAH) presentation.
Summary of Previous Research Thunderstorm breakdown: North Alabama – 83 storms Washington D.C. – 2 storms Houston TX – 13 storms Dallas – 9 storms • Schultz et al. (2009), JAMC • Six separate lightning jump configurations tested • Case study expansion: • 107 T-storms analyzed • 38 severe • 69 non-severe • The “2σ” configuration yielded best results • POD beats NWS performance statistics (80-90%); • FAR even better i.e.,15% lower (Barnes et al. 2007) • Caveat: Large difference in sample sizes, more cases are needed to finalize result. Slide contents borrowed from Schultz (UofAH) presentation.
Summary of Previous Research • Schultz et al. 2011, WAF • Expanded to 711 thunderstorms • 255 severe, 456 non severe • Primarily from N. Alabama (555) • Also included • Washington D.C. (109) • Oklahoma (25) • STEPS (22) Slide contents borrowed from Schultz (UofAH) presentation.
Summary of Previous Research • Remember . . . • The LJA Can: • Indicate when an updraft is strengthening or weakening on shorter timescales than current radar and satellite • Identify when severe or hazardous weather potential has increased • “Tip the scales” on whether or not to issue a severe warning • The LJA Cannot: • Predict severe weather potential in every severe storm environment. • Discern severe weather types • i.e., a certain jump does not mean there will be a certain type of severe weather • Issue specific types of severe warnings Slide contents borrowed from L. Carey (UofAH) presentation.
Summary of Previous Research • The performance of using a 2σ Lightning Jump as an indicator of severe weather looks verypromising (looking at POD, FAR, CSI)! But . . . • The Schultz studies were significantly manuallyQCed, for things like consistent and meteorologically sound storm cell identifications. • How would this approach fare in an operational environment, where forecasters do not have the luxury of baby-sitting the algorithms?
Current Project: Goals • Primary Goal: • Remove the burden of manual intervention via automation then compare results to previous studies to see if an operational Lightning Jump will have operational value. • Secondary Goals: • Use & evaluate a more “reliable” storm tracker (WDSSII K-means (NSSL) over TITAN (NCAR) and SCIT (NSSL)). • Provide an opportunity to conduct improved verification techniques, which require some high-resolution observations. • But the bigger picture: • “Objective - To refine, adapt and demonstrate the LJA for transition toGOES-R GLM (Geostationary Lightning Mapper) readiness and to establish a path to operations.” (from L. Carey presentation)
Current Project: Progress • Purpose: Evaluate potential for Schultz et al. (2009, 2011) LJA to improve NWS warning statistics, especially False Alarm Ratio (FAR). • Objective, real-time WDSSII cell tracking (radar-based example upper right) • LMA-based total flash rates (native LMA, not GLM proxy). • Increased sample size over variety of meteorological regimes (LMA test domains bottom right) • Enhanced verification data, SHAVE – (Severe Hazards Verification Experiment), and methods Storm Objects WSR-88D WDSSII K-means storm tracker. DCLMA OKLMA NALMA WTLMA OKLMA SWOK KSC LMA Test Domains Slide contents borrowed from L. Carey (UofAH) presentation.
Current Project: Progress • Data collected from April through October, 2012, includes: • 2000+ SHAVE storm reports • 190+ identified storms in the LMA domains • Early stages of data analysis – focusing on a small handful of picturesque cases
Current Project: Progress Storm trends associated with the tracked storm that produced the EF1 tornado in Norman, OK on 13 April 2012. This storm moved through the center of the OKLMA domain and produced large hail as well as the tornado damage in Norman. Time series of the total lightning flash rate (orange) and the Maximum Expected Size of Hail (MESH) and time of the lightning jumps (yellow) and severe hail (blue) are shown. (From Project Executive Summary) (Image from NSSL)
Current Project: Future Work • Complete full data analysis • Potential for another round of data gathering and analysis, applying lessons learned • Explore enhanced verification techniques
Related, but Beyond Scope • How will the results of this study using LMA data translate to using GLM data (or GLM proxy)? • Differences in sensors, detection technique, and sensor resolution