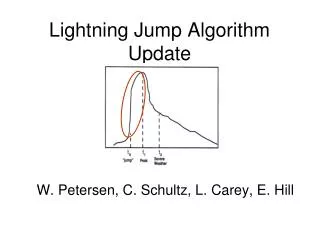
Lightning Jump Algorithm Update
In this update, we present significant advancements in the Lightning Jump Algorithm developed by Schultz, Petersen, and Carey. We analyzed a total of 638 thunderstorms, confirming the algorithm's exceptional performance with a Probability of Detection (POD) of 82% and a False Alarm Rate (FAR) of 35%. The study also explored lightning activity in various storm environments, such as severe and non-severe cases, and emphasized the importance of total lightning trends over cloud-to-ground lightning rates. Future work includes integrating satellite data and improving real-time forecasting capabilities for storm development.

Lightning Jump Algorithm Update
E N D
Presentation Transcript
C. Schultz, W. Petersen, L. Carey GLM Science Meeting 12/01/10 Lightning Jump Algorithm Update
Where we left you in ’09 Thunderstorm breakdown: North Alabama – 83 storms Washington D.C. – 2 storms Houston TX – 13 storms Dallas – 9 storms • Six separate lightning jump configurations tested • Case study expansion: • 107 T-storms analyzed • 38 severe • 69 non-severe • The “2σ” configuration yielded best results • POD beats NWS performance statistics (80-90%); • FAR even better i.e.,15% lower (Barnes et al. 2007) • Caveat: Large difference in sample sizes, more cases are needed to finalize result. • M.S. Thesis completed and study accepted to JAMC (Schultz, Petersen, Carey 2009); forms the conceptual basis of the lightning jump ATBD
Case Expansion • Since, we’ve expanded to 638 thunderstorms • Primarily from N. Alabama (537) • Also included • Washington D.C. (49 and counting) • Oklahoma (30 and counting) • STEPS (22) • Regional expansion has proven robust • POD: 82%, FAR 35%, avg. lead time: 22 mins.
DC LMA Results • 14 of 15 missed events by the 2σ algorithm were 1 tree knocked down • 64 severe events total for the DC sample. • Lightning jumps observed before almost every hail and tornado case • 1 tornado missed in entire sample (remnants of TS Nicole) Skill Scores, 2σ, DC LMA region Example, tornadic storm July 16, 2007
Proving the Utility of Total Lightning • Examined total and CG rates in 30 thunderstorms in four regions of country • Total lightning trends outperform CG lightning trends • Schultz et al., WAF, accepted, editing
Low topped/cold season and tropical environments • 40% of misses in these environments. • Can we still provide utility by tailoring algorithm? • Answer: • Tropical maybe, cold/low topped, tougher. Time-height plot of reflectivity (top) and total flash rate (bot) for an EF-1 producing tornadic storm on March 25, 2010. Tornado touchdown time ~2240 UTC.
Cold Season/Low Topped • Average peak flash rates: • Severe 11.53 flashes min-1, all have at least 1 flash • Non Severe: 6.60 flashes min-1 • Some separation occurs at 6 flashes min-1
Landfalling Tropical Systems • Analyzed 8 landfalling TC’s within range of an LMA/LDAR • Average Peak Flash Rates • Severe: 6.60 flashes min-1, 5 storms w/o any flashes • w/o no flash storms, avg. flash rate 8.90 flashes min-1 • Non Severe 6.35 flashes min-1 • 0.29 flashes min-1 if non severe from Charley are removed Charley
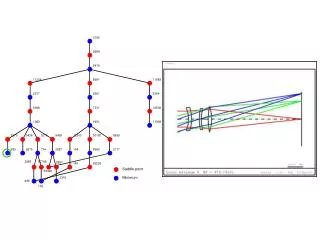
SB CAPE 18Z August 13, 2004 0-3 km Helicity 18Z August 13, 2004 No tornado, but increases in rotation observed Total Flash Rate (flashes min-1) Total Flash Rate (flashes min-1) 100 km from radar SB CAPE 18Z Sept. 25, 2005 Purple line – total flash rate (flashes min-1) Contours - Merged Azimuthal Shear, Smith and Elmore (2004), using WDSS-II 0-3 km Helicity 18Z Sept. 25, 2005 100 km from radar
Other “misses” • e.g., Feb 6, 2008 EF-4 tornado producing storm, 1117 UTC • Downward trend in total lightning masks any small pulses in electrical activity. 230 severe 408 non severe
Examining Environments • Goal: Using commonly used environmental parameters to determine when total lightning will be of most use. Other parameters; temp, theta, theta-e, RH, e,es, r,rvs, etc.
Future Work • Incorporate other satellite/radar products • Have robust satellite dataset from GOES-O/P tests • In what capacity does high temporal satellite and total lightning information benefit nowcasting of storm growth and decay? • Reflectivity/rotation comparisons • Testing of algorithm in real-time this summer at Redstone and White Sands • Work the GLM lightning proxy along with the proxy in the cell tracking framework.