Roadmap
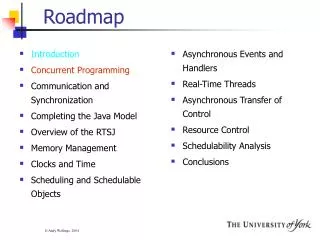
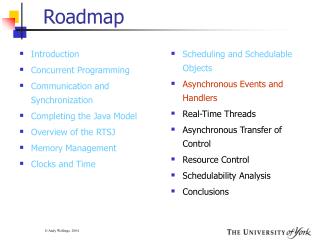
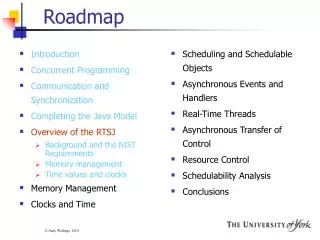
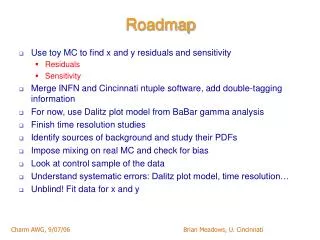
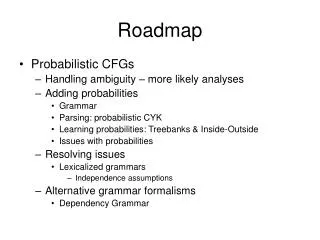
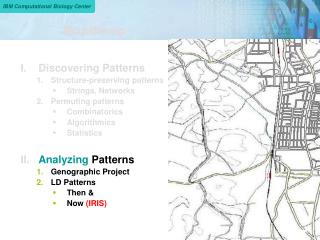
Roadmap. Discovering Patterns Structure-preserving patterns Strings, Networks Permuting patterns Combinatorics Algorithmics Statistics Analyzing Patterns Genographic Project LD Patterns Then & Now (IRIS).

Roadmap
E N D
Presentation Transcript
Roadmap • Discovering Patterns • Structure-preserving patterns • Strings, Networks • Permuting patterns • Combinatorics • Algorithmics • Statistics • Analyzing Patterns • Genographic Project • LD Patterns • Then & • Now (IRIS)
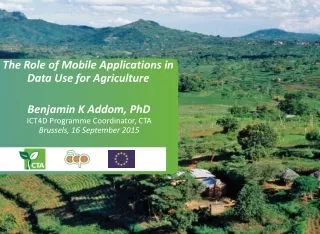
Who ? National Geographic and IBM on a five year study, launched in April 2005 What ? Although fossil records fix human origins in Africa, little is known about the great journey that took Homo sapiens to the far reaches of the earth. How did we, each of us, end up where we are? How ? Using genetics as a tool : samples all around the world are being collected and the mtDNA and NRY chr are being analyzed phylogeographic question
Public Participation Over 250,000 public participants to date (April, 2008) www.nationalgeographic.com/genographic www.ibm.com/genographic www.ibm.com/dna
How? • Each of us carries ancestral material marked by signatures due to imperfections in DNA replication • SNP’s (Single Nucleotide Polymorphisms) • STR numbers (Short Tandem Repeats) • Inversions • …..etc…… • Uni-parental Model (topology=tree) • Non-recombining segments of genome
mtDNA Micro-Phylogeny Tree 22 (coding-region) SNPs The Genographic Project Public Participation MtDNA Database, Behar et al, PLoS Genetics. 2007
Locus 16000 bp 58 mill bp 0.38%
Missing information in unilinear transmissions past present
Population over generations (flow of ancestral material) past MRCA present
Bi-parental Model past GMRCA MRCA present
What is recombination? Genetic recombination is the process by which a strand of DNA is broken & then joined to the end of a different DNA molecule. It occurs during meiosis and between paired chromosomes. This process leads to offspring having different combinations of genes from their parents
Recombnations Capture:Requirements Specification • Enumerate the (multiple) recombinations • Statistical averages not adequate.. • Identify the participating lineages • Detect ancient recombinations as well as recent ones
Then our task is to: Estimate the phylogenetic network, called the Ancestral Recombinations Graph (ARG) ARG coined by Griffiths & Marjoram, 1996 Joint work with Marta Mele, Jaume Bertranpetit, Francesc Callafel
An Inconvenient Truth Theorem: Given data D, the problem of computing the ARG G with minimum number of recombinations is NP-complete.
An Inconvenient Truth Theorem: Given data D, the problem of computing the ARG G with minimum number of recombinations is NP-complete. Recall other inconvenient truths…. Theorem: The problem of computing the most parsimonious tree T is NP-complete.
Flavors of hardness…. (Uni-parental) • In a NON infinite-sites model, TREE construction hard • No back mutations; No parallel mutations • But reality is infinite-sites • Yet, problem is tractable, in practice (Bi-parental) • In a pure recombinations model, problem is hard • Generally a “statistical average” has been pursued thru LD… • Combining potentially misleading mutations with recombinations makes the general problem intractable in practice
Tractability Model(Balance between reality and simplicity) • Use characteristics of the observed haplotypes • Use a compatible network model (not a generic phylogenetic model)
IRIS(IdentifyingRecombinationsInSequences) Stage Haplotypes: use SNP block patterns biological insights Segment along the length: infer trees computational insights Infer network (ARG)
Stage 1: Staging the Input 0 1 2 3 4 5 6 7 8 910 1 2 3 4 5 6 7 8 910 1 2 3 4 5 6 7 8 0) 1 1 1 1 1 1 1 1 1 1 1 1 1 1 1 1 1 1 1 1 1 1 1 1 1 1 1 1 1 3 1 1) 1 3 4 2 3 2 2 2 2 3 4 3 3 3 3 2 2 3 3 4 4 3 2 2 2 2 2 2 1 2 1 2) 1 3 4 2 3 2 2 2 2 3 4 3 3 3 3 2 2 3 3 4 4 3 2 4 1 1 4 3 2 6 1 3) 1 3 5 2 3 2 2 2 2 4 5 1 1 1 1 1 3 1 4 1 5 4 3 5 3 4 5 3 1 3 1 4) 2 1 1 1 1 1 1 1 1 1 1 1 1 1 1 1 1 1 1 1 1 1 1 0 3 0 3 3 1 2 1 5) 2 1 1 1 1 1 1 1 1 1 1 1 1 1 1 1 1 1 1 1 1 1 1 1 1 1 1 1 115 1 6) 2 1 1 1 1 1 1 1 1 1 1 1 1 1 1 1 1 1 1 1 1 1 1 2 2 2 2 2 1 3 1 7) 2 1 2 2 2 2 2 2 2 2 2 1 1 1 2 2 2 2 1 1 1 1 1 3 2 3 3 3 1 3 1 8) 2 1 2 2 2 2 2 2 2 2 2 1 1 1 2 2 2 2 1 2 2 2 2 2 2 2 2 2 111 1 9) 2 3 4 2 3 2 2 2 2 3 4 3 3 3 3 2 2 3 3 4 4 3 2 4 1 1 4 3 2 8 1 10) 2 3 5 2 3 2 2 2 2 4 5 1 1 1 1 1 3 1 4 1 5 4 3 5 3 4 5 3 1 5 1 11) 3 2 3 2 2 3 2 3 2 2 3 2 2 2 3 2 2 2 2 3 1 1 1 3 2 3 3 3 1 6 1 12) 3 2 3 2 2 3 2 3 2 2 3 2 2 2 3 2 2 2 2 3 1 1 1 0 1 1 4 3 2 2 1 13) 5 1 1 1 1 1 1 1 1 1 1 1 1 1 1 1 1 1 1 1 1 1 1 1 1 1 1 1 1 2 1 14) 5 1 6 2 2 2 2 2 2 5 3 4 2 2 3 3 2 3 1 1 1 1 1 1 1 1 1 1 1 2 1 15) 7 2 3 2 2 3 2 3 2 2 3 2 2 2 3 2 2 2 2 3 1 1 1 3 2 3 3 3 1 2 1 16) 7 2 3 2 2 3 2 3 2 2 3 2 2 2 3 2 2 2 2 3 1 1 1 6 1 1 1 1 1 2 1 17) 3 2 3 2 2 3 2 3 2 2 3 2 2 2 3 2 2 2 2 3 0 2 2 2 2 2 2 2 1 1 1 18) 2 1 1 1 1 1 1 1 1 1 4 3 3 3 3 2 2 3 3 4 4 3 2 4 1 1 4 3 2 1 1 19) 1 1 1 1 1 1 1 1 1 1 1 1 1 1 1 1 1 1 1 1 1 1 1 1 1 1 1 5 1 1 1 20) 3 2 3 2 2 3 2 3 2 2 3 2 2 2 3 2 2 3 3 4 4 3 2 4 1 1 4 3 2 1 1 21) 2 3 5 2 3 2 2 2 2 4 5 1 1 1 1 1 3 1 4 1 5 4 3 5 2 2 2 2 1 1 1 22) 5 1 2 2 2 2 2 2 2 2 2 1 1 1 2 2 2 2 1 2 2 2 2 2 2 2 2 2 1 1 1
Ancestral Recombination Graph (ARG) (our characterization) ARG is a fortified compatible graph: • Defined on k segments G(k) • A node can have at most 2 incoming edges (2 parents) • When 2 parents: denotes recombination of two segments; incoming edge is labeled by one segment each
Stage 3: Trees to ForestDSR Algorithm Input: Two graphs G1 and G2 Output: Consensus ARG G Optimization Topology DSR
DSR Algorithm Overview initialization • Let G1 and G2 be defined on leaf labels L • Let universe U L • P1 and P2 are partitions on U at leaf level • DO-WHILE • A network structure with nodes in G and the labels derived from P1 and P2 • Universe U this nodes in G • Increment layer and update P1 and P2 as sets on U of this layer • P1 has labels from G1 • P2 has labels from G2 • WHILE (P1 is nonempty) OR (P2 is nonempty) iterative loop
Walk-through of DSR Algorithm (0 2 5 9 12-14 16 18-20 23-24 28-30 33 35-36) 2 7:24:1 7:25:1 (1 6 8 17 21-22 26 31) 1 7:25:2 (7 11 15 34 37) 1 7:25:3 (25) 1 7:70:7 (3 10 27) 1 7:25:4 (4) 1 7:00:9 (32) 1 7:00:0 (0 5 13-14 16 23-24 29-30) 1 8:27:1 (1 6 8 17 21-22 26) 1 8:27:2 (19 36) 1 8:27:5 (2 9 12 18 20 31) 1 8:28:2 (3-4 7 10-11 15 25 27-28 32 34-35 37) 1 8:80:6 (33) 1 8:00:0
DSRDominantSubdominant Recombinant • Dominant: labels of G1 AND G2 • Subdominant: label of G1 OR G2 • Recombinant: no labels (NEITHER G1 NOR G2) Rules: 1. Each row and each column has at most one dominant ELSE has at most one subdominant ELSE all recombinants 2. A non-recombinant can have non-recombinants either in its row or its column but NOT both
DSR Algorithm: X-matrix P2 P1 labels P1 P2 labels
DSR Algorithm: Assign DSR colors (optimization) P2 P1 labels P1 P2 labels
DSR Algorithm: rows & cols DSR P2 P1 labels P1 P2 labels
DSR Algorithm: rows & cols DSR P2 P1 labels P1 P2 labels
DSR Algorithm: rows & cols DSR P2 P1 labels P1 P2 labels
DSR Feasible Topology Next layer Last layer
chr21:14505500 -14602168 Chinese (2 subpops: CBx, HNx); Japanese (JTx) data • Around 200 SNPs • Around 100 haplotypes
Network Median-joining networks for inferring intraspecific phylogenies, Bandelt, Forster & Rohl,Molecular Biology and Evolution, Vol 16, 37-48, 1999
IRIS(IdentifyingRecombinationsInSequences) 1234567890123456789012345678901234567890123456789012345678901234567890123456789012345678901234567890123456789012345678901234511111111111111111111111111111111111111112222222222222222222222222222222222233333333344444444455555555555555----
IRIS: Non-recombining Cluster Ids 11 12 13 14 15 16 0 17 1 18 4 19 65 20 8 21 9107 22 23 32 24
Chr 21 locus: Preliminary Results • Not distinguishable share recent & ancient recombinations • No pop-specific mutation/recombination
The Big Picture Ecosystem Population Genomics Species Organism Physiology Metabolism Network Function Structure Sequence
Thank You! … success stories in bioinformatics will depend on algorithmic and statistical ingenuity. Pavel Pevzner