Download
1 / 23
240 likes | 355 Vues
What do children need? Jonathan Bradshaw and Gill Main. Conway Hall, London 19-20 June 2014. Third Peter Townsend Memorial Conference Poverty and Social Exclusion in the UK. PSE method. Selection of indicators Previous PSE Comparability with FRS Items identified by children

E N D
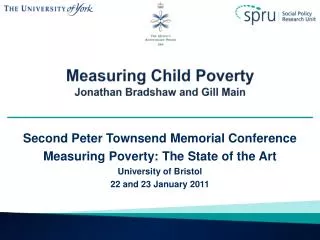
What do children need?Jonathan Bradshaw and Gill Main Conway Hall, London 19-20 June 2014 Third Peter Townsend Memorial Conference Poverty and Social Exclusion in the UK
PSE method • Selection of indicators • Previous PSE • Comparability with FRS • Items identified by children • Adults (aged 16+, not just parents) asked to indicate whether item/s activities were necessities for children • Items deemed necessities if 50%+ of adults say children need them
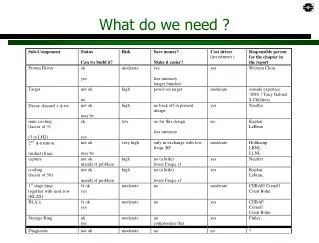
Differences by sub-group • Tested based on confidence intervals and relative risk ratios • Differences examined based on: • Age • Gender • Ethnicity • Country • Marital status • Presence of children • Being a lone parent • Number of children • Income • Social class • Education level • Tenure type • Subjective health • Objective health • Political affiliation
Differences by sub-group • For 12 items/activities, no significant differences by sub-group; a further 7 only 1-2 differences • Trousers, money, MP3, trainers and snack all 5+ significant differences • Education, objective health and income related to the most items/activities
Education Relative risk of those with degree or higher regarding items/activities as necessities, compared to those with no qualifications
Income Relative risk of those in the richest two quintiles regarding items/activities as necessities, compared to those in the poorest two quintiles
Differences by sub-group • There were generally fewer significant differences between sub-groups of the population for items and activities where support was stronger • Very few items, and no activities, with strong (>75%) support and any significant sub-group differences • Three meals – difference base on age group • Meat – difference based on educational level
Differences by sub-group • Some sub-groupings with non-linear associations to % seeing items/activities as necessities • Significant U-shaped relationship with age for four items and activities: • Bedroom (lowest % at age 45) • Save (lowest % at age 47) • Style (lowest % at age 37) • Snack (lowest % at age 42) • Most likely age group to be parents of children who these items are relevant for? • But presence of children in household not significantly associated with differences for any of these items/activities
Differences by sub-group • Significant, inverted-U shape associations with income quintile (ie. richest and poorest least likely to see as necessity) for: • Clothes • Money • Holiday • All with moderate levels of support: • Clothes 65% • Money 54% • Holiday 52%
Perceptions of necessity by ownership/participation – just necessities
Protecting children – adults and children in households with children In 93% of households where children go without adequate food, at least one adult skimped on their food ‘sometimes’ or ‘always’ to ensure others have enough to eat.
Conclusions • Perceptions of necessities for children have for the most part remained relatively stable between 1999 and 2012. • Some items – eg. computer and internet – more important. • Some items identified as important by children meet criteria for SPNs • Poverty evidently viewed as a relative issue • Perceptions of necessities very stable across sub-groups • Most differences based on education, income and health • Worse-off more likely to see items/activities as necessities • Sub group differences greater where there is less strong agreement that item/activity is necessary • Perceptions of necessity are somewhat related to prevalence of ownership • Stronger relationship amongst necessities • Not all items/activities which are owned by a (substantial) majority seen as necessities • Adults and parents are protective of children • Stronger support for items/activities as necessities for children • Adults in households with children go without to provide for children