Visualization
Explore the impact of visualization on cognition, cost structures, and future trends. Learn how visual representations amplify cognition and support various tasks. Dive into the discussion of societal implications and collaborative InfoViz.


Visualization
E N D
Presentation Transcript
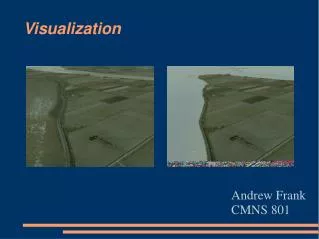
Visualization Leslie Wu Loren Yu
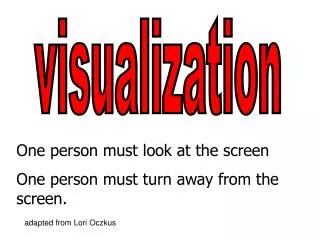
Is this a good visualization? http://tinyurl.com/6rr22g
What is visualization? Definition: The use of computer-supported, interactive, visual representations of data to amplify cognition • Situations / Tasks / Users (STUs)
Creating good visualizations “I wonder if people [build upwards from ‘building blocks’] to create the next best visualization, [or if theory comes after the visualization] to justify why the visualization is a good one?” - Marcia Lee
Cost Structure • Different visual representations have different cost structures. • Some visual characteristics are “automatically” recognized, while others require conscious effort to interpret
How does visualization amplify cognition? • Increasing available memory and processing resources • Reducing search costs • Visual detection of patterns • Perceptual inference operations • Perceptual attention for monitoring • Encoding information
Consequences of Visualization “[W]hen do you use visuals and when do you just show a table?" - Neil Patel Easier is not necessarily better “[R]etention occurs alongside some amount of expended effort… [I]f I have to spend less effort thinking about something, I'm less likely to remember it” - Neema Moraveji“I wonder if the ease of representing information in a particular form colors how we approach it… If we continually see tables used to organize information, do we become less receptive to the data it models?" - Amal Aziz
Visualizations for whom? A. In which domains would visualization be most useful? • "I would also be interested to read some discussion of professions or domains that could really benefit from increased work in the area of information visualization. Who uses a vast amount of complex data that presents a visualization challenge?" - Sara Mitchell B. How does visualization fit into societal organizations? • "Where does visualization fit into to large systems of human minds working together?" - Nick Wolfe
Visualization in the Future • Different Domains: Scientific Visualization vs. Information Visualization • Visualization for the Masses • Mobilization/Miniaturization of visualization“[I]t would be nice to explore the different possibilities of [mobile] devices. How much context can be used…? - Nick Briggs • Automatically generating visualizations based on user models"it would be neat to see a system that models user behavior… [to generate visualizations] that would respond well to human senses and perception..." – Michael Smith
Collaborative InfoViz and Social Cognition • Many Eyes comments: http://services.alphaworks.ibm.com/manyeyes/browse/comments • Hans Rosling: http://www.ted.com/index.php/talks/view/id/92