Download
1 / 2

E N D
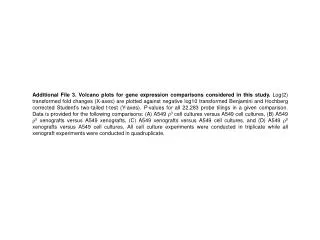
Additional File 3. Volcano plots for gene expression comparisons considered in this study. Log(2) transformed fold changes (X-axes) are plotted against negative log10 transformed Benjamini and Hochberg corrected Student’s two-tailed t-test (Y-axes). P-values for all 22,283 probe tilings in a given comparison. Data is provided for the following comparisons: (A) A549 r0 cell cultures versus A549 cell cultures, (B) A549 r0 xenografts versus A549 xenografts, (C) A549 xenografts versus A549 cell cultures, and (D) A549 r0 xenografts versus A549 cell cultures. All cell culture experiments were conducted in triplicate while all xenograft experiments were conducted in quadruplicate.
-4 -4 -4 -4 -3 -3 -3 -3 -2 -2 -2 -2 -1 -1 -1 -1 0 0 0 0 1 1 1 1 2 2 2 2 3 3 3 3 4 4 4 4 4 4 4 3 3 3 2 2 2 1 1 1 0 0 0 4 A B 3 -Log10 B-H corrected P 2 1 0 Log2 Fold Change Log2 Fold Change A549 r0 vitro versus A549 vitro A549 r0 vivo versus A549 vivo C D -Log10 B-H corrected P Log2 Fold Change Log2 Fold Change A549 vivo versus A549 vitro A549 r0 vivo versus A549 r0 vitro Magda et al. Additional File 3