A549
Panel C. Panel A. Panel B. Calu6. A549. H661. H460. BRM.

A549
E N D
Presentation Transcript
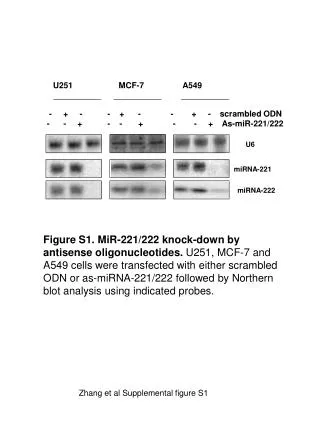
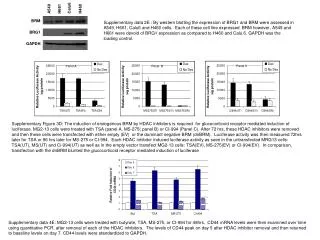
Panel C Panel A Panel B Calu6 A549 H661 H460 BRM Supplementary Figure 3D: The induction of endogenous BRM by HDAC inhibitors is required for glucocorticoid receptor mediated induction of luciferase. MG2-13 cells were treated with TSA (panel A, MS-275( panel B) or CI-994 (Panel C). After 72 hrs, these HDAC inhibitors were removed and then these cells were transfected with either empty (EV) or the dominant negative BRM (dnBRM). Luciferase activity was then measured 72hrs later for TSA or 96 hrs later for MS-275 or CI-994. Each HDAC inhibitor induced luciferase activity as seen in the untransfected MRG13 cells: TSA(UT), MS(UT) and Ci-994(UT) as well as in the empty vector transfect MG2-13 cells: TSA(EV), MS-275(EV) or CI-994(EV). In comparison, transfection with the dnBRM blunted the glucocorticoid receptor mediated induction of luciferase BRG1 GAPDH Supplementary data 4E: MG2-13 cells were treated with butyrate, TSA, MS-275, or CI-994 for 48hrs. CD44 mRNA levels were then examined over time using quantitative PCR, after removal of each of the HDAC inhibitors. The levels of CD44 peak on day 5 after HDAC inhibitor removal and then returned to baseline levels on day 7. CD44 levels were standardized to GAPDH. Supplementary data 2E : By western blotting the expression of BRG1 and BRM were assessed in A549, H661, Calu6 and H460 cells. Each of these cell line expressed BRM however, A549 and H661 were devoid of BRG1 expression as compared to H460 and Calu 6. GAPDH was the loading control.