Download
1 / 1
10 likes | 134 Vues

E N D
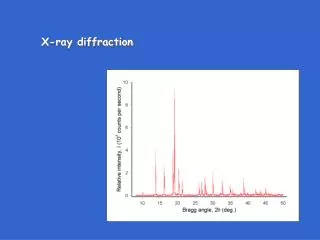
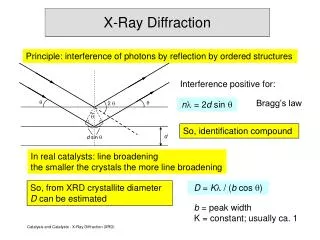
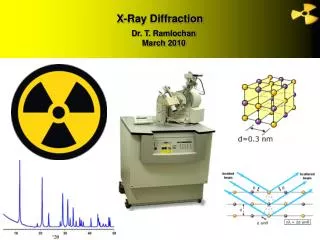
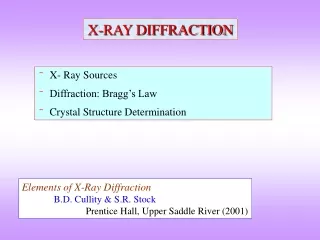
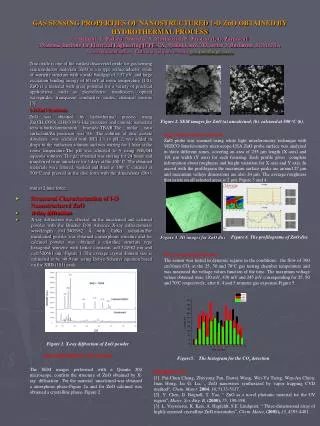
GAS SENSING PROPERTIES OF NANOSTRUCTURED 1-D ZnO OBTAINED BY HYDROTHERMAL PROCESSG. Telipan1, L. Pislaru-Danescu1, V. Marinescu1, P. Prioteasa1, G. Zarnescu11National Institute for Electrical Engineering ICPE-CA, Splaiul Unirii 313, sector 3, Bucharest, ROMANIACorrespondent author: Gabriela Telipan, e-mail: gtelipan@icpe-ca.ro Zinc oxide is one of the earliest discovered oxide for gas sensing semiconductor materials. ZnO is a n type semiconductor oxide of wurtzite structure with a wide bandgap of 3.37 eV and large excitation binding energy of 60 mV at room temperature [1-2]. ZnO is a material with great potential for a variety of practical applications, such as piezoelectric tranduscers, optical waveguides, transparent conductive oxides, chemical sensors [3]. 1-D ZnO Synthesis ZnO was obtained by hydrothermal process using Zn(CH3COO)2x2H2O 98% like precursor and cationic surfactant tetra-n-buthylammonium bromide-TBAB.The molar ratio surfactant/Zn precursor was 0.6. The solution of zinc acetate dihydrate was acidified with HCl 1:1 to pH 2, was added in drops to the surfactant solution and was stirring for 1 hour at the room temperature.The pH was adjusted to 9 using NH4OH aqueous solution. The gel obtained was stirring for 24 hours and transferred to an autoclave for 3 days at the 100o C. The obtained materials were filtered, washed and dried at 100o C calcined at 500oC and pressed in the disc form with the dimensions 6x1 mm at 2 tone force. Structural Characterization of 1-D Nanostructured ZnO X-Ray diffraction X-ray diffraction was effected on the uncalcined and calcined powder with the Brucker D08 Advance X-ray diffractometer wavelength =1.5405982 Å with CuK radiation.For uncalcined powder was obtained a amorphous structure and for calcined powder was obtained a cristaline structure type hexagonal wurtzite with lattice constants a=0.324982 nm and c=0.520661 nm,.-Figure 1. The average crystal domain size is estimated to be 48.9 nm using Debye-Scherrer equation based on the XRD (101) peak. Figure 3. 3D images for ZnO disc Figure 2. SEM images for ZnO (a) uncalcined; (b). calcined at 500oC(b). Light interferometry analysis ZnO probe was scanned using white light interferometry technique with VEECO Interferometry microscope-USA ZnO probe surface was analyzed in three different zones, covering an area of 255 μm length (X axis) and 191 μm width (Y axis) for each focusing. Each profile gives complete information about roughness and height variation for X axis and Y axis. In accord with the profilogram the maximum surface peaks are around 27 μm and maximum valleys dimensions are also 24 μm. The average roughness that exists on all selected areas is 2 μm. Figure 3 and 4. Figure 6. The profilograme of ZnO disc The gas sensing properties The sensor was tested in dynamic regime in the conditions: the flow of 300 cm3/min CO2 at the 25, 50 and 70oC gas testing chamber temperature and was measured the voltage values function of the time. The maximum voltage values obtained were 320 mV, 430 mV and 245 mV corresponding for 25, 50 and 70oC respectively, after 6, 4 and 5 minutes gas exposure-Figure 5. Figure 1. X-ray diffraction of ZnO powder Figure5. The histogram for the CO2 detection Scanning electron microscopy The SEM images performed with a Quanta 200 microscope, confirm the structure of ZnO obtained by X-ray diffraction . For the material uncalcined was obtained a amorphous phase-Figure 2a and for ZnO calcined was obtained a crystalline phase- Figure 2 REFERENCES [1]. Pai-Chun Chang, Zhiyyong Fan, Dawei Wang, Wei-Yu Tseng, Wen-An Chiou, Juan Hong, Jia G. Lu, „ ZnO nanowires synthesized by vapor trapping CVD method“, Chem. Mater. 2004, 16, 5133-5137. [2]. Y. Chen, D. Bagnall, T. Yao, “ ZnO as a novel photonic material for the UV region”, Mater. Sci. Eng. B, (2000),75, 190-198. [3]. L. Vayssieres, K. Keis, A. Hagfeldt, S.E. Lindquist, “ Three-dimensional array of highly oriented crystalline ZnO microtubes”, Chem. Mater, (2001), 13, 4395-4401.