Download
1 / 35
350 likes | 432 Vues
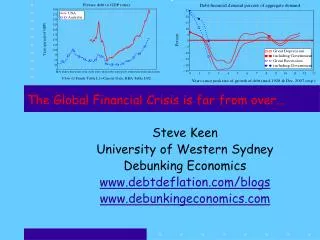
The Global Financial Crisis: What’s Next?. Bank Guarantee Fund Conference Warsaw, May 21, 2010 Mark Allen Senior IMF Resident Representative for Central and Eastern Europe. Outline of presentation. Forecasts of the recovery Factors that might hold back recovery

E N D
The Global Financial Crisis: What’s Next? Bank Guarantee Fund Conference Warsaw, May 21, 2010 Mark Allen Senior IMF Resident Representative for Central and Eastern Europe
Outline of presentation • Forecasts of the recovery • Factors that might hold back recovery • Situation of the financial sector • Fiscal worries • Summary
Good News: the world economy is recovering … Change in GDP (Year on year) Emerging Developed World Source: World Economic Outlook, April 2010
… and the recovery in 2010 is faster than we expected. Real GDP growth forecasts USA Eurozone Apr 2010 Jan 2010 UK China Oct 2009 Jun 2009 Source: World Economic Outlook Apr 2009
Recover is driven by the rebound in world trade ... Merchandise exports (Three month moving average, year on year) Emerging World Developed Source: Directions of Trade, April 2010
…and restocking. Industrial Production (Annualized percent change of 3mma over previous 3mma) Global IP Global Manf. PMI (sa, 50+=Expansion; rhs) Source: World Economic Outlook, April 2010
And financial markets are back from the brink too. Sovereign and Corporate Bond Spreads (basis points) Global Stocks (Morgan Stanley MSCI Stock Price Indices in USD, MER Weighted; 2007 = 100) Advanced economies: corporate1 Mar-10 Mar-10 2007 2008 2009 2007 2008 2009 Source: Bloomberg 1 Averages of BB-B US, BB-B Euro, and BBB Japan corporate bond spreads.
Factors that might hamper growth • US savings rates
Brakes on Growth: 1. U.S. Saving Rate? U.S. Household Saving Ratio (in percent of disposable income)
Factors that might hamper growth • US savings rates • Global imbalances
Brakes on Growth: 2. Global imbalances? Current account balances (billion dollars) Source: World Economic Outlook, April 2010
Factors that might hamper growth • US savings rates • Global imbalances • High unemployment
Brakes on Growth: (3) High unemployment? Unemployment (percent) Source: World Economic Outlook, April 2010
Factors that might hamper growth • US savings rates • Global imbalances • High unemployment • Bubbles in emerging markets
Brakes on Growth: 4. Overheating in some emerging markets? Real Domestic Credit Growth and Equity Valuation (Standard deviations from long-term average) High Credit Growth High Valuation Real credit growth Local equity valuation Source: Global Financial Stability Report, April 2010
Factors that might hamper growth • US savings rates • Global imbalances • High unemployment • Bubbles in emerging markets • Commodity supplies
Brakes on Growth: 5. Commodity prices? Principal commodities prices (Jan-09 = 100) Source: Bloomberg; staff estimates
Factors that might hamper growth • US savings rates • Global imbalances • High unemployment • Bubbles in emerging markets • Commodity supplies • Availability of credit
Brakes on Growth: 6. Credit supply? Nonfinancial Private Sector Credit (Annual percent growth) Source: Global Financial Stability Report, April 2010
Stronger growth has helped banks … Average global growth 2007-2010 (percent, right scale) Bank writedowns (US$ trillions, left scale) Source: Global Financial Stability Report, April 2010
… which have written down losses and raised capital. (billions of US$) percent Expected additional writedowns/loss provisions (left scale) Realized writedowns/loss provisions (left scale)
But funding maturities have shortened. Mature Market Bank Bond Maturities (Percentage of initial stock) Years Source: Global Financial Stability Report, April 2010
Nonbank credit only partly offsets weak bank credit. Contributions to nonfinancial private sector credit growth (Percent) USA Euro Area UK Source: Global Financial Stability Report, April 2010
Sovereign risk now threatens to take the crisis to a new stage. The Four Phases of the Crisis (10-yr sovereign swap spreads, percent) I. Financial crisis Buildup II. Systemic outbreak III. Systemic response IV. Sovereign Crisis? Source: Bloomberg
Debt levels in advanced economies are increasing sharply … Public Debt (Percentage of GDP) Advanced economies Emerging and Developing economies Source: World Economic Outlook, April 2010
… and structural deficits are set to worsen. Increase in aging-Related Spending in G20 Advanced Economies (Percentage of GDP over 2010 aging-related spending) Source: World Economic Outlook, April 2010
The increase in debt is due to recession… G-20 Advanced Economies: Increase in Public Debt, 2008-15 (Total increase: 39.1 percentage points of GDP; 2009 PPP weighted GDP) Source: World Economic Outlook, April 2010; Staff estimates
… which has undermined revenue expectations. Real GDP (2000=100) USA Euro area Japan Oct. 2007 WEO Oct. 2007 WEO Oct. 2007 WEO Current WEO Current WEO Current WEO Source: World Economic Outlook
Sovereign borrowing is increasing sharply. Net Borrowing Needs (percentage of GDP) 2003-08 average 2009 2010 (est) 2011 (est) United States Euro Area United Kingdom Source: Global Financial Stability Report, April 2010
Risk premia reflect fiscal challenges and external financing risks … Contributions to Five-Year Sovereign CDS Spreads (basis points)
… and sensitivity to fundamentals is growing -3% = 60% debt to GDP CDS Spreads (year average) Greece General Government Balance (as a percent of GDP) Source: World Economic Outlook April 2010, Bloomberg
Problems in peripheral Europe may haunt banks in the core … USD 100 bln Source: BIS
… while the sovereign’s creditworthiness affects that of its banks Average percent change in local senior financial CDS Percent change in sovereign CDS October 2009 to March 2010 Source: Global Financial Stability Report, April 2010
Conclusions • Recovery stronger than expected • But could easily be derailed • The banking system cannot provide much credit • The crisis has worsened fiscal positions • Fiscal problems may feed back to banking systems • But growth in emerging markets and trade may continue to surprise