Download
1 / 95
960 likes | 1.21k Vues
Reassessment of the Long-term Mortality Risks of Active and Passive Smoking 1) “The Long-term Mortality Risks of Active Smoking and the Need for a Reassessment” James E. Enstrom, Ph.D., UCLA “Reassessment of the Mortality Risks of Passive Smoking in the United States”

E N D
Reassessment of the Long-term Mortality Risks • of Active and Passive Smoking • 1) “The Long-term Mortality Risks of Active Smoking and the Need for a Reassessment” • James E. Enstrom, Ph.D., UCLA • “Reassessment of the Mortality Risks of Passive Smoking in the United States” • Geoffrey C. Kabat, Ph.D., Einstein College of Medicine, New York • “Silencing of Science: The Phenomenon and Its Impact on Passive Smoking Epidemiology” • Sheldon B. Ungar, Ph.D., University of Toronto • 4) Additional Discussion: “Trofim Denisovich Lysenko and Pseudoscience in the Soviet Union (1927-1962)”
Rationale for Symposium 1) Important epidemiologic findings regarding active and passive smoking have been ignored or mischaracterized in prior assessments 2) Rigorous scientific principles require that all epidemiologic findings must be fairly and consistently assessed 3) “Silencing” of politically incorrect epidemiologic findings is ethically and scientifically wrong 4) The credibility of epidemiology is seriously damaged when ideology and politics replace rigorous scientific principles
Goals for Symposium • To present evidence that the long-term mortality risks of active smoking are greater than generally believed and the long-term mortality risks of passive smoking are less than generally believed • To establish the credibility of this largely ignored or mischaracterized epidemiologic evidence • To make the case that future research and future assessments need to be conducted objectively and transparently, free of ideology and politics
Background on Enstrom 33 years of epidemiologic research at UCLA 28 years of conducting and/or analyzing prospective epidemiologic cohorts: California Mormons California Physicians Prevention Magazine Subscribers Alameda County Study Cohort United States Veterans Cohort NHANES Epidemiologic Followup Study Cohort California Cancer Prevention Study Cohort Themes: low-risk subgroups and different perspectives
California Cancer Prevention Study • 1,078,000 total subjects in 25 states enrolled by American Cancer Society with late 1959 questionnaire and followed for mortality during 1960-1972 (CPS I) • 2) 118,000 California subjects followed for mortality during 1960-1998 and a 1999 questionnaire survey--at UCLA with special permission from ACS (CA CPS I) • 3) This is the largest epidemiologic cohort followed for at least 39 years
Need for Reassessment Regarding Active Smoking 1) BMJ Table 10 shows strong 39-year relationship between active smoking and lung cancer 2) 90% reduction in US tar-adjusted per capita cigarette consumption 3) Continuing high US lung cancer death rate with 160,000 deaths per year 4) Population impact of smoking cessation not fully understood or evaluated
BMJ Table 10 • 1960-1998 Active Smoking and Lung Cancer Deaths • Late 1959 Males Females • smoking statusRR (95% CI)RR (95% CI) • Never 1.0 1.0 • Former 3.5 (2.8-4.4) 1.5 (1.1-2.0) • Current • 1-9 cpd 4.1 (2.9-5.8) 2.0 (1.5-2.6) • 10-19 7.9 (6.1-10.1) 5.1 (4.2-6.1) • 20 12.5 (10.0-15.6) 9.1 (7.7-10.8) • 21-39 16.4 (13.0-20.8) 15.1 (12.3-18.7) • 40-80 18.7 (14.5-24.0) 15.8 (11.8-21.1) • All current 11.9 (9.6-14.7) 6.2 (5.4-7.2)
1900-2005 U.S. Per Capita Cigarette Consumption and Tar-Adjusted Consumption Number of cigarettes Per capita Tar adjusted Data source: Tobacco Outlook Report, Economic Research Service, U.S. Dept. of Agriculture.
1930-2005 U.S. Age-adjusted Lung Cancer Death Rates Deaths per 100,000 Total population Never smokers Data Source: NCHS Vital Statistics; Death rates are age-adjusted to 2000 US standard population.
Conventional Benefits of Smoking Cessation (Enstrom & Heath EPIDEMIOLOGY 1999) CA CPS I Males Lung cancer death rate ratios by smoking status at entry 1960-1969 Late 1959 smoking statusDeath Rate Ratio Current 12.3 Former Quit < 1 year (1959) 13.0 Quit 1-4 years (1955-58) 8.9 Quit 5-9 years (1950-54) 4.7 Quit 10-19 years (1940-49) 2.7 Quit 20+ years (<1939) 1.8 Never 1.0
Natural Experiment of Smoking Cessation (Enstrom & Heath EPIDEMIOLOGY 1999) Cigarette smoking prevalence among CA CPS I subjects who smoked in late 1959, based on follow-up surveys of survivors. Sex1959196519721999 Males 100% 74% 51% 7% Females 100% 86% 66% 7%
Natural Experiment of Smoking Cessation (Enstrom & Heath EPIDEMIOLOGY 1999) Relative risk of lung cancer death in CA CPS I cohort: 41,000 current cigarette smokers as of late 1959 compared with 50,000 never smokers Follow-up period (by decade) Sex1960-19691970-19791980-19891990-1997 Males 12.6 12.1 12.5 10.2 (7.9-20.2) (8.1-18.0) (8.5-18.4) (6.1-17.0) Females 2.5 6.3 7.0 7.8 (1.7-3.8) (4.7-8.3) (5.4-9.0) (5.8-10.4)
Additional • Natural Experiments of Smoking Cessation • US Veterans Study: 106,000 males followed 1954-1979 • (Enstrom J Clin Epi 1999) • 2) NHEFS: 700 males & 1100 females followed 1971-1992 (Enstrom J Clin Epi 1999) • 3) Iowa Women’s Health Study: 37,000 women 1986-1999 • “decline in excess lung cancer risk among former smokers is prolonged compared with other studies . . . excess lung cancer risk persisted up to 30 years” • (Ebbert, et al. J Clin Oncol 2003)
Randomized Controlled Trials With A Smoking Cessation Intervention 1) Whitehall Civil Servants Study 1,445 high risk male smokers from London advised in 1970 (JECH 1978, JECH 1982, JECH 1992) 2) Multiple Risk Factor Intervention Trial (MRFIT) 12,866 high risk US males enrolled in 1972 (JAMA 1982, Circulation 1996, Ann Epi 1997) 3) Lung Health Study (LHS) 5,887 US/CN male and female smokersenrolled in 1986 (JAMA 1994, AJRCCM 2002, AIM 2005)
Smoking cessation in three RCTs: intervention group (I) versus control group (C) Intervention Average Cessation Studyperiod (years)during intervention period Intervention Control Whitehall 1 ~60% ~25% MRFIT 6 ~45% ~20% LHS 5 ~35% ~15%
Initial RCT lung cancer deaths and relative differences, (I-C)/C, and 95% CI (%) StudyFollow-up yearsLung cancer deaths(I-C)/C & 95% CI I C (%) Whitehall* 10.5 22 ~24* - 8.3 MRFIT 7 34 28 +21.4 LHS 5 20** 19 + 5.3 TOTAL 76 71 + 7.0 (-15.5 to +33.7) *deaths & incident cases, which are scaled (714/731) **only “special intervention—placebo” group included
Full RCT lung cancer deaths and relative differences, (I-C)/C, and 95% CI (%) StudyFollow-up yearsLung cancer deaths(I-C)/C & 95% CI I C (%) Whitehall* 20 45 ~50* - 10.0 MRFIT 16 135 117 +15.0 LHS 14.5 77** 89 - 13.5 TOTAL 257 256 + 0.4 (-11.5 to +13.5) *deaths & incident cases, which are scaled (714/731) **only “special intervention—placebo” group included
Tobacco Smoke and Involuntary Smoking • IARC Monographs on the Evaluation of Carcinogenic Risks to Humans, Volume 83 • May 2004 1452 pages • Coverage of Smoking Cessation • Standard comparison of lung cancer rates among former smokers, current smokers, and never smokers • Nothing on population impact versus successful quitters • Nothing on “natural experiments” • Nothing on randomized controlled trials
THE HEALTH BENEFITS OF SMOKING CESSATION A Report of the Surgeon General 1990 (628 pages) PREFACE BY THE SURGEON GENERAL “Taken together, the evidence clearly indicates that smoking cessation has major and immediate health benefits for men and women of all ages.” MAJOR CONCLUSIONS “ the health consequences of smoking cessation for those who quit smoking in comparison with those who continue to smoke: 1. Smoking cessation has major and immediate health benefits for men and women of all ages.”
SUMMARY: Active Smoking & Cessation • Long-term mortality risk of lung cancer due to active smoking is greater than generally believed because it less reversible by cessation than generally believed based on evidence presented • The lung cancer mortality risk ratios for self-selected former smokers compared with never smokers do not accurately reflect the population impact of smoking cessation • 2) Long-term “natural experiments” in cohorts within the United States do not show convergence of smoker and never smoker death rates in spite of substantial smoking cessation • 3) Randomized controlled trials involving smoking cessation do not show a significant reduction in lung cancer deaths in the intervention groups relative to the control groups
Factors Impeding Reassessment 1) Complex Issue: population impact of cessation versus focus on successful quitters 2) “Wrong Message”: negative findings supposedly discourage smokers from quitting 3) Uncertainty: implies lung cancer etiology and benefits of cessation are not completely understood 4) “Silencing”: ignored in major consensus reports and general information to the public 5) “Conflict of Interest”: some of the above research has been funded by the tobacco industry
May 2006 EPIDEMIOLOGY Lead Editorial: “On Conflicts of Interest” Five Commentaries: “Kafka's Truth-seeking Dogs” “What to Declare and Why?” “He Who Pays the Piper, Calls the Tune…” “Why Focus Only on Financial Interests?” “A Conflict-of-Interest Policy for Epidemiology”
Conflict of Interest & BMJ Paper • 1) Because the final portion of the funding for the CA CPS I study came from the tobacco industry, attention was diverted from the substance of the BMJ paper to allegations of tobacco industry influence • Because the BMJ findings do not fit the anti-smoking advocacy • agenda, the ACS and key anti-smoking activists have conducted an ongoing campaign of ad hominem attack, character assassination, • and “silencing” with regard to Enstrom & Kabat • Most troubling are the false and misleading statements made about • the BMJ paper by certain powerful US epidemiologists, which will be presented following the discussion of Lysenko & Soviet pseudoscience • The Enstrom & Kabat experience illustrates the difficulty of • conducting “politically incorrect” tobacco epidemiology
Reassessment of the Mortality Risks of Passive Smoking in the United StatesGeoffrey C. Kabat, Ph.D.
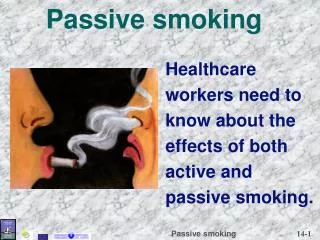
Background • ETS contains many carcinogens and toxins • exposure is widespread and involuntary • active smoking is a major cause of avoidable morbidity and mortality
Environmental tobacco smoke • ETS is a mixture of sidestream smoke from the burning tip of the cigarette (70-90%) and exhaled mainstream smoke (10-30%). Over time the mixture ages and is deposited on surfaces. • ETS is both different qualitatively and much more dilute than the smoke the active smoker inhales -- how much more dilute? 1/10th? 1/100th? 1/1,000th? • the effects of ETS can only be studied in never smokers
Need for reassessment of passive smoking • implausible that ETS could cause a 30% increase in CHD risk given that ETS is much more dilute than actively inhaled smoke and RR for active smoking is ~1.8-2.0 • strength of association depends on which studies are included in meta-analysis • issue is difficult to assess objectively because of enormous political stakes
Meta-analyses of ETS and LC RR95% CI US EPA (1992) – US studies 1.19(1.04-1.35)* Hackshaw et al. BMJ (1997) 1.23 (1.13-1.34) IARC (2004) -- females 1.24 (1.14-1.34) IARC (2004) – males 1.37 (1.02-1.83) *90% CI
Meta-analyses of ETS and CHD RR95% CI Law et al. BMJ (1997) 1.30(1.22-1.38) He et al. NEJM (1999) 1.25 (1.17-1.32) Thun et al. EHS (1999) 1.25 (1.17-1.33)
Estimates of US deaths due to ETS Lung cancer 3,000 -- 5,000 CHD 35,000 – 60,000
Follow-up of California CPS I cohort • followed for mortality from 1960 through 1998 • 118,094 adults, of whom 35,561 were never-smokers with a spouse • ETS exposure based on smoking status of the spouse in 1959, 1965, & 1972 • 7,159 respondents to 1999 questionnaire provided assessment of their self-reported total ETS exposure
Deaths for analysis of active and passive smoking – 1960-1998 Total cohortNever smokers CHD 19,485 5,932 Lung Cancer 2,970 156 COPD 2,243 264
Active smoking and CHD death, 1960-1998 MalesFemales Active smoking status RR 95% CI RR 95% CI • Never smoked 1.0 --- 1.0 --- • Former smoker 1.2 (1.1-1.3) 1.0 (0.9-1.1) • Current smoker • 1-9 cpd 1.2 (1.1-1.3) 1.1 (1.0-1.2) • 10-19 1.4 (1.3-1.5) 1.4 (1.3-1.5) • 20 1.6 (1.5-1.7) 1.8 (1.7-1.9) • 21-39 1.8 (1.6-1.9) 2.0 (1.8-2.3) • 40-80 1.9 (1.7-2.1) 2.4 (2.0-2.9) • All current smokers 1.5 (1.5-1.6) 1.5 (1.4-1.6)
ETS and CHD death, 1960-1998 Males Females RR 95% CI RR 95% CI All 1959 participants followed 1960-98 Never 1.00 --- 1.00 --- Former 0.94 (0.78-1.12) 1.02 (0.93-1.11) Current 0.94 (0.75-2.22) 1.01 (0.93-1.09) 1-9 cpd 0.97 (0.78-1.21) 1.13 (0.97-1.33) 10-19 0.86 (0.70-1.05) 1.03 (0.91-1.17) 20 0.92 (0.74-1.15) 1.04 (0.92-1.16) 21-39 1.16 (0.79-1.69) 0.95 (0.80-1.12) 40+ 1.29 (0.75-2.22) 0.83 (0.65-1.06)
Active smoking and lung cancer death, 1960-1998 MalesFemales Active smoking status RR 95% CI RR 95% CI • Never smoked 1.0 --- 1.0 --- • Former smoker 3.5 (2.8-4.4) 1.5 (1.1-2.0) • Current smoker • 1-9 cpd 4.1 (2.9-5.8) 2.0 (1.5-2.6) • 10-19 7.9 (6.1-10.1) 5.1 (4.2-6.1) • 20 12.5 (10.0-15.6) 9.1 ( 7.7-10.8) • 21-39 16.4 (13.0-20.8) 15.1 (12.3-18.7) • 40-80 18.7 (14.5-24.0) 15.8 (11.8-21.1) • All current smokers 11.9 (9.6-14.7) 6.2 (5.4-7.2)
ETS and lung cancer death, 1960-1998 Males Females RR 95% CI RR 95% CI All 1959 participants followed 1960-98 Never 1.00 --- 1.00 --- Former 0.92 (0.37-2.30) 1.08 (0.73-1.60) Current 0.69 (0.34-1.39) 0.93 (0.65-1.33)
Summary of BMJ results • exposure to spousal smoking was not associated with increased mortality from lung cancer or CHD (3 follow-up intervals) • exposure was weakly associated with increased mortality from COPD • active smoking showed strong dose-response relationships with lung cancer, CHD, and COPD (BMJ table 10)
Conclusion of BMJ paper “The results do not support a causal relationship between ETS and mortality, although they do not rule out a small effect. The association between ETS and CHD and lung cancer may be considerably weaker than generally believed.”
American Cancer Society • ACS cohort studies CPS I and CPS II account for the vast majority of data on ETS and CHD • ACS contends that CPS I cannot be used to address passive smoking because in 1960s everyone was exposed
Response to ACS criticisms • not true that everyone was exposed to ETS • majority of women in CA CPS I cohort were “homemakers” • in their 1999 meta-analysis, Thun et al. saw fit to include 2 cohort studies initiated in the 1960’s • ACS has the ability to check our analysis for 1960-1972
Misclassification of ETS exposure spousal exposure may not reflect total ETS exposure since there are other sources of exposure misclassification was lower in certain sub-groups 1999 questionnaire showed that smoking status of spouses was directly related to a history of total exposure to ETS misclassification was not sufficient to obscure a true association between ETS & CHD, particularly in women
Spousal smoking vs. self-reported ETS exposure among CA CPS I never smokers -- females History of regular ETS exposure as of 1999 (%) 1959 spousal smoking None Light Moderate Heavy Never 62 24 11 3 Current 1-19 cigs/day 26 29 39 6 Current 20-39 cigs/day 20 21 41 18 Current 40+ cigs/day 16 13 48 24 Enstrom & Kabat, BMJ 2003
ETS and CHD: comparison of CA CPS I and CPS II Females Enstrom (CA CPS I) Steenland (CPS II) Spousal smoking Never 1.00 --- 1.00 --- Former 1.02 (0.93-1.11) 1.00 (0.90-1.48) Current 1-19 cpd 1.07 (0.96-1.19) 1.15 (0.90-1.48) 20 cpd 1.04 (0.92-1.16) 1.07 (0.83-1.40) 21-39 cpd 0.95 (0.80-1.12) 0.99 (0.67-1.47) 40+ 0.83 (0.65-1.06) 1.04 (0.67-1.61) Current – total 1.01 (0.93-1.09) 1.10 (0.96-1.27) Ever 1.01 (0.94-1.08) 1.04 (0.95-1.15)
New meta-analysis US CHD studies Enstrom & Kabat, Inhalation Toxicology (2006). • includes published studies of CPS I and CA CPS I • applies consistent criteria for inclusion of results RRcurrent/never =1.04 (0.99-1.10) RR ever/never = 1.04 (0.99-1.10) Thun et al., Environ Health Perspect (1999) RRexposed/not exposed = 1.22 (1.13-1.30)
Meta-analysis of US lung cancer studies • case-control & cohort studies • includes Enstrom & Kabat, 2003 RRever/never = 1.10 (1.00-1.21)
Jenkins, “16 Cities Study”(1993-94) • 100 nonsmokers in each of 16 metro areas collected 24-hr air samples both at work and away from work using personal monitoring • participants filled out questionnaires about their exposures and gave a pre- and post- saliva sample • samples were analyzed for 10 markers of ETS, including RSP and nicotine