Download
1 / 21
210 likes | 457 Vues
Electrochemical Measurement of Toxic Metal Contaminants in the Waters of the Golden Triangle Area. By: Progga Chirontoni Mentor: Dr. Andrew Gomes Dan F. Smith Department of Chemical Engineering, Lamar University. Texas STEM Conference-2014, Beaumont, TX. Overview. About Heavy Metals

E N D
Electrochemical Measurement of Toxic Metal Contaminants in the Waters of the Golden Triangle Area By: ProggaChirontoniMentor: Dr. Andrew Gomes Dan F. Smith Department of Chemical Engineering, Lamar University Texas STEM Conference-2014, Beaumont, TX
Overview • About Heavy Metals • Detection Techniques • Nano-band electrode system and electrochemistry • Optimization • Results • Conclusion
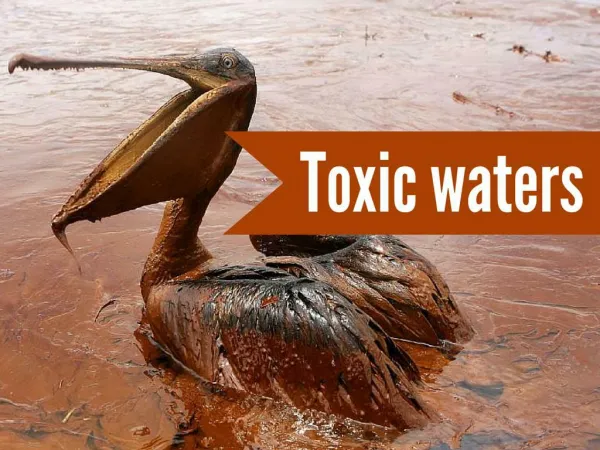
Heavy metals in the environment • Toxic metals such as lead, cadmium, copper and arsenic are referred to as heavy metals • Widespread Occurrence (regulated by federal and regional agencies) • Presence of chemical, petrochemical and metal-work industries in Golden Triangle area
Detection Techniques LABORATORY-BASED 1. Spectrometric techniques (Hydride generation atomic absorption spectrometry (HG-AAS), Graphite furnace atomic absorption spectrometry (GFAAS), Atomic fluorescence spectrometry (AFS)) 2. Inductively coupled plasma (ICP) techniques (ICP-Atomic emission spectrometry (AES), ICP-Mass Spectrometry (MS)) 3. High performance liquid chromatography (HPLC) and ICP-MS 4. Laser induced breakdown spectroscopy (LIBS) FIELD-DEPLOYABLE 1. X-ray fluorescence 2. Colorimetric assays (spectrophotometers) 3. Electrochemical methods (Polargraphic techniques, Cathodic stripping voltammetry (CSV), Anodic stripping voltammetry (ASV))
Anodic Stripping Voltammetry (ASV) • Principle Deposition step: + 2 + 2 + 2 + Stripping step:
ADVANTAGES OF ASV 1. Large linear concentration range- from few mg/L to 0.1μg/L. 2. Sensitivity of less than 0.1 ppb 3. Selectivity 4. Matrix effect immunity to samples with high ionic content 5. Automated analysis and battery powered portable devices can be developed 6. Extremely safe for monitoring, does not require vigorous heating, concentrated acid, etc. 7. Rapid analysis (10-15 min) 8. Inexpensive Analysis DISADVANTAGES OF ASV 1. As(V) in the sample has to be chemically reduced to As(III), increasing the sample analysis time. 2. Interferences
Instrumentation- Nano-band electrode system • Nano-Band™ Explorer Portable instrument • Explorer Software to operate the instrument • Iridium electrode (for Lead, cadmium, copper)Carbon Nano-Band™ Electrode (for Arsenic) • Auxiliary electrode (Platinum) • Reference electrode (Ag/AgCl) Pictures of the Nano-Band electrode developed and fabricated at TraceDetect • http://www.envirotechpubs.com/pdf/iet/2005/03/iet200503_046.pdf
Advantages of Nanoelectrodes • Enhanced mass transport • Signal amplification • Greater number of measurement points • Great scope for parallel measurements • No requirement of removal of dissolved oxygen • More inert and much less sensitive to accidental over-voltage conditions Disadvantages of Nanoelectrodes • Surface-fouling • Fragility
Procedure • Cleaning the Electrodes • Electrode Set up and Thin film plating - Carbon electrode and gold plating solution for As- Iridium electrode and mercury plating solution for Pb, Cd and Cu • Conditioning • Verification • Screening the sample for dissolved metal ion • Method of Standard addition
Method of Standard Addition Voltammograms for lead standards (left) and the calibration curve (right).
Optimization: Deposition Potential and Plate Time Arsenic (III) stripping current vs. depositionpotential Arsenic (III) stripping current vs. plate time
Optimization: Effect of Supporting Electrolyte Concentration Plot of Stripping current of As (III) versus the HCL concentration
Interference Peaks • The concentration of copper metal in drinking water is higher thanother metals • So ASV scans usually have Copper interference peaks Ways to remove interference: • KI solution • Peak separation and Analysis software ASV scan of 20 ppb arsenic (III) in 2 M HCl having copper interference peak around 450 mV
Sampling • Samples were collected from 1. 29 different locations in theGolden Triangle area. • From both upstream and downstream Neches river andSabine lake, samples were collected. • pH and conductivity were measured. • Hydrochloric acid was added until their pH was 2. • Filtered with PTFE membrane filter. 2. 1. Neches river2. Filtration of sample
Sample Locations Sampling locations [A-E] (about every 5 miles upstream)
Results Concentration of heavy metals found in water samples in parts per billion ** Below detection limit Arsenic could not be detected in any of the samples
Conclusions • Heavy metals such as Pb, Cd, Cu are present in the waters of golden triangle area • Within the permissible limit determined by EPA • No immediate danger of metal contamination in this area • Should be monitored in both day and night
Future Works • Extend this research outside Golden Triangle Area in South Texas • Analysis of organic chemicals in waters of Golden triangle area: organoarsenic, atrazine, diazinon, metalachor, and trenbolone • Explore different detection techniques like Liquid chromatography and Mass spectrometric methods
Acknowledgements • Department of Chemical Engineering, Lamar University • Department of Chemistry and Biochemistry, Lamar University • Office for Undergraduate Research (OUR), Lamar University • Research Enhancement Grant, College of Engineering
References • Bryan, G.W., W.J. Langston, “Bioavailability, accumulation and effects of heavy metals in sediments with special reference to United Kingdom estuaries; a review”, • Environmental Pollution, 76 (1992), pp. 89–131. • Millward, G.E., A. Turner, Metal pollution ,in: J.H. Steele, S.A. Thorpe, S.A. Turekian Encyclopedia of Ocean SciencesAcademic Press, San Diego, CA (2001), pp. 1730–1737. • CSEM (Case Studies in Environmental Medicine), Agency for Toxic Substances and Disease Registry, Lead Toxicity, WB 1105, August 20 (2010). • Hem, J.D. Water Resources Res (1972), 8, 661-679. • Environmental Protection Agency, www.epa.gov. • Texas Annual Water quality report 2012, City of Beaumont, Water Utilities Department.