Activity Diagrams
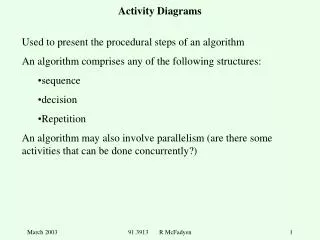
Activity Diagrams. Activity Diagram. Activity diagrams describe the workflow behavior of a system. Activity diagrams are used in process modeling and analysis of during requirements engineering.

Activity Diagrams
E N D
Presentation Transcript
Activity Diagram • Activity diagrams describe the workflow behavior of a system. • Activity diagrams are used in process modeling and analysis of during requirements engineering. • A typical business process which synchronizes several external incoming events can be represented by activity diagrams. • They are most useful for understanding work flow analysis of synchronous behaviors across a process.
Activity Diagram • Activity diagrams are used for • documenting existing process • analyzing new Process Concepts • finding reengineering opportunities. • The diagrams describe the state of activities by showing the sequence of activities performed. • they can show activities that are conditional or parallel.
Activity Diagram Concepts • An activity is trigged by one or more events and activity may result in one or more events that may trigger other activity or processes. • Events start from start symbol and end with finish marker having activities in between connected by events. • The activity diagram represents the decisions, iterations and parallel/random behavior of the processing. • They capture actions performed. • They stress on work performed in operations (methods).
When to Use Activity Diagrams • The main reason to use activity diagrams is to model the workflow behind the system being designed. • Activity Diagrams are also useful for: • analyzing a use case by describing what actions need to take place and when they should occur • describing a complicated sequential algorithm • modeling applications with parallel processes • Activity Diagrams should not take the place ofinteraction diagrams and state diagrams. • Activity diagrams do not give detail about how objects behave or how objects collaborate.
Components • An activity is an ongoing, though interruptible, execution of a step in a workflow (such as an operation or transaction) • Represented with a rounded rectangle. • Text in the activity box should represent an activity (verb phrase in present tense).
Components • An event is triggered by an activity. It specifies a significant occurrence that has a location in time and space. • An instance of an event (trigger) results in the flow from one activity to another. • These are represented by directed straight lines emerging from triggering activity and ending at activity to be triggered. Label text for events should represent event but not the data involved. • A decision may be shown by labeling multiple output transitions of an activity with different guard conditions. • For convenience a stereotype is provided for a decision: the traditional diamond shape, with one or more incoming arrows and with two or more outgoing arrows, each labeled by a distinct guard condition with no event trigger.
How to Draw an Activity Diagram • Diagrams are read from top to bottom and have branches and forks to describe conditions and parallel activities. • A fork is used when multiple activities are occurring at the same time. • A branch describes what activities will take place based on a set of conditions. • All branches at some point are followed by a merge to indicate the end of the conditional behavior started by that branch. • After the merge all of the parallel activities must be combined by a join before transitioning into the final activity state.
Activity Diagram Example Start State Activity Fork Branch Join Merge End State
Use Case • Withdraw money from a bank account through an ATM
Disadvantages • A disadvantage of activity diagrams is that they do not explicitly present which objects execute which activities, and the way that the messaging works between them. • Labeling of each activity with the responsible object can be done. • It is useful to draw an activity diagram early in the modeling of a process, to help understand the overall process. • Then interaction diagrams can be used to help you allocate activities to classes.
References • Activity Diagrams • http://pigseye.kennesaw.edu/~dbraun/csis4650/A&D/UML_tutorial/activity.htm • http://isds.bus.lsu.edu/cvoc/learn/bpr/cprojects/spring1998/modeling/activity.html • http://www-106.ibm.com/developerworks/rational/library/2802.html • Fast Track UML 2 (from Books 24x7)