Download
1 / 31
310 likes | 400 Vues
This report by CCbenefits, Inc. details the socioeconomic benefits of Suffolk County Community College on the regional economy. The main volume, executive summary, fact sheet, and detailed results highlight the college's impact due to operations spending and past student productivity effects. The study covers college operations spending, past student contributions, and total earnings in the college service area. Additionally, the investment analysis component evaluates student benefits, external social benefits, medical and crime savings, return to taxpayers, and benefit-cost ratios. This comprehensive report demonstrates the significant role of the college in regional economic development.

E N D
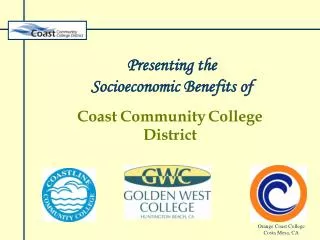
Suffolk County Community College Presenting the Socioeconomic Benefits of
Reports Produced by CCbenefits, Inc. • Main Volume(98 pages) • Executive Summary(6 pages) • Fact Sheet(1 page) • Detailed Results(10 pages) • Narrow & Broad Taxpayer Results(1 page) • PowerPoint Presentation
1. RegionalEconomic Development 2. Investment Analysis Components of the Study
Beginning with the Regional Analysis
Regional Economic Development What we measure: • We begin with the usual multiplier impacts due to college operations spending. • To this we add impacts associated with past students still active in the local workforce. • Together, these measure the impact of the college relative to total earnings in the college service area.
College Operations Spending Colleges are similar to other local industries in that they spend money and employ people. College operations spending include direct earnings of faculty and staff, as well as the indirect earnings due to associated multiplier effects. 1. College Operations Spending
Direct earnings: SCCC q employed 980 full - time and 1,712 part - t ime faculty and staff in FY 2003 . This amounts to a total payroll of $101.0 million . Indirect earnings: Faculty q and staff wages and salaries add $52.3 million worth of income as they are spent in the local region. College Operations Spending
Past-Student Productivity Effects 1. College Operations Spending 2. Past-Student Productivity Effects In addition to college operations spending, we add the impacts (higher earnings) associated with students who have obtained their education at our college and are still active in the local workforce.
Direct Earnings: Past students q $527.8 million contribute an estima ted worth of added income per year to the regional economy after leaving SCCC . Indirect Earnings: T he estimated q multiplier effect of past student earnings in other industries increase $537.5 million . output by yet another Past-Student Productivity Effects
Total Earnings in College Service Area 1. College Operations Spending 2. Past-Student Productivity Effects 3. Total Earnings in College Service Area This comprises all of the earnings in the defined economic region. This provides the backdrop for expressing the relative role of college operations spending and past student productivity effects in the local region.
The defined economic region q $27.6 billion generated in total earnings in FY 2003 . Of this, the college operations q spending and past student productivity effects accounted for $1.2 billion , or 4.4% of all regional earnings. Total Earnings in College Service Area
To Summarize… Earnings $1,000 % of Total College Service Area This comprises the total earnings in the defined economic region.
To Summarize… Earnings $1,000 % of Total College Service Area Direct Earnings: Faculty and Staff This is the salaries and wages of the college, expressed as a fraction of the region’s total earnings.
To Summarize… Earnings $1,000 % of Total College Service Area Direct Earnings: Faculty and Staff Indirect earnings Indirect earnings stem from the action of multiplier effects. They occur as college salaries and operating expenditures ripple through the regional economy. The multiplier is the sum of direct and indirect earnings divided by direct earnings.
To Summarize… Earnings $1,000 % of Total College Service Area Direct Earnings: Faculty and Staff Indirect earnings Direct Earnings: Past Students We now add the direct earnings of past students still active in the local workforce. These students add value because of the education they obtained while attending college.
To Summarize… Earnings $1,000 % of Total College Service Area Direct Earnings: Faculty and Staff Indirect earnings Direct Earnings: Past Students Indirect Earnings Next we add the earnings indirectly explained by the actions of past students in the local economy.
To Summarize… Earnings $1,000 % of Total College Service Area Direct Earnings: Faculty and Staff Indirect earnings Direct Earnings: Past Students Indirect Earnings Grand Total The total shows the extent to which the activities of the college impact the regional economy.
Investment Analysis Continuing with the
Investment Analysis Component What we measure: • Thestudent benefits due to higher earnings • A broad collection of externalsocial benefits • Medical savings • Crime savings • Welfare and unemployment savings • The return to taxpayers for their support • Broad taxpayer perspective • Narrow taxpayer perspective
Higher earnings = Student costs = Student Benefits This figure shows the present value of increased future earnings as a direct result of the students’ education. Student costs consist of the tuition paid by the students and, most importantly, the opportunity cost of time (earnings foregone).
Higher earnings = Student costs = Benefit/Cost Ratio: Student Benefits Benefit/Cost Ratio: The ratio of benefits over costs. A 1.5 ratio, for example, means that every dollar invested will return a cumulative $1.50 to the investor over the time period analyzed. Criterion for feasibility: The B/C ratio must be greater than or equal to 1.
Higher earnings = Student costs = Benefit/Cost Ratio: Rate of Return: Student Benefits Rate of Return: the average earning power of the money used over the life of the investment. A 15% rate of return, for example, means that the revenues collected over time will equal the costs, plus generate a 15% return. Criterion for feasibility: the rate of return must exceed the returns from alternative uses of the same money.
Higher earnings = Student costs = Benefit/Cost Ratio: Rate of Return: Payback Period: Student Benefits Payback Period: This is the length of time needed from the beginning of the investment before the cumulative future revenues return all of the investments made.
Achieving an A ssociate Degree from q SCCC will increase earnings to $42,819 per year, or 35.1% more than the average high school graduate. An A ssociate Degree graduate will q earn $452,509 more than someone with a hi gh school diploma or GED over his or her future career. Lifetime earnings will increase $6.58 q for every dollar invested (tuition, fees, books, and foregone earnings). Student Benefits Some Key Findings
Aggregate. Medical Savings Crime Savings Welfare/Unemployment Savings Total Social Benefits The medical, crime and welfare/unemployment savings are avoided costs, i.e., the reduced burdens on employers and taxpayers. These external social benefits are generated annually as the education level of the workforce increases.
Benefit/Cost Ratio: Return to Taxpayers Broad Taxpayer Perspective Taxpayers Costs = State Appropriations + Property Taxes Taxpayer Benefits =Higher Earnings + Social Benefits The broad perspective: State taxpayers invest, but beneficiaries are widely dispersed (students, business community, society). We count all of the benefits regardless of to whom they accrue.
Return to Taxpayers Narrow Taxpayer Perspective Taxpayers Costs = State Appropriations + Property Taxes Taxpayer Benefits =More Taxes Collected + Social Benefits Here we only count the “book revenues”—the monies actually returning to the state treasury. For example, as students increase their earnings, the state collects more sales, income, and property taxes.
Benefit/Cost Ratio: Rate of Return: Payback Period: Return to Taxpayers Narrow Taxpayer Perspective Note that for a public investment, the typical expectation is that the benefit/cost ratio be > 1 and that the rate of return be > 4%. As you can see, the results far exceed these expectations.
The SCCC r egional economy is measurably stronger Taxpayers in the State of New York are measurably better off The SCCC s tudents are measu rably better off To Summarize… • IT PAY$ BACK: • IT PAY$ TO INVEST: • IT PAY$ TO LEARN: