Download
1 / 53
540 likes | 656 Vues
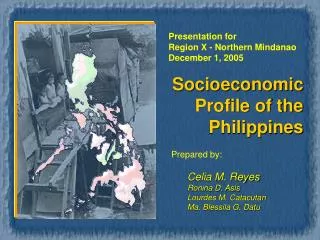
Presentation for Region X - Northern Mindanao December 1, 2005. Socioeconomic Profile of the Philippines. Prepared by: Celia M. Reyes Ronina D. Asis Lourdes M. Catacutan Ma. Blessila G. Datu. Outline. Objectives Profile Decomposition of poverty Summary. Objective of the Presentation.

E N D
Presentation for Region X - Northern Mindanao December 1, 2005 SocioeconomicProfile of the Philippines Prepared by: Celia M. Reyes Ronina D. Asis Lourdes M. Catacutan Ma. Blessila G. Datu
Outline • Objectives • Profile • Decomposition of poverty • Summary
Objective of the Presentation • Present the poverty profile using the PIDS online database
List of Indicators • Poverty Incidence • Magnitude of Poor • Subsistence Incidence • GDP Growth Rate • Population • Population Density • Unemployment Rate • Access to Safe Water • Access to Sanitary Toilet Facilities • Access to Electricity
List of Indicators • Proportion of Families living in Makeshift Housing Materials • Infant Mortality • Prevalence of Malnutrition among 0-5 Year-old Children, 2001 (International Standard) • Elementary Participation Rate • Secondary Participation Rate • Elementary Cohort Survival Rate • Secondary Cohort Survival Rate • Functional Literacy Rate
Poverty Incidence, 2003Source: FIES 2003, NSCB Philippines – 24.7
Poverty Incidence, 2000 Camiguin 53.1 Misamis Occidental 43.4 Misamis Oriental 27.6 Bukidnon 32.2 Lanao del Norte 50.8 Region X – 36.9 Based on Estimates released in 2003.
Poverty Incidence, 1997-2000Region X New Methodology
Magnitude of Poor Families, 2003Philippines Philippines – 3,966,396
Subsistence Incidence, 2003 Philippines – 10.4
Subsistence Incidence, 2000 Camiguin 20.3 Misamis Occidental 22.7 Misamis Oriental 11.7 Bukidnon 14.5 Lanao del Norte 30.5 Region X – 18.5 Based on Estimates released in 2003.
Population, 2000(in millions) Philippines – 76.5
Population, 2000 Camiguin 0.1 Misamis Oriental 1.1 Misamis Occidental 0.5 Bukidnon 1.1 Lanao del Norte 0.8 Region X – 3.5
Population Density, 2000 Philippines – 255
Population Density, 2000 Camiguin 323 Misamis Oriental 208 Misamis Occidental 251 Bukidnon 128 Lanao del Norte 196 Region X – 205
Unemployment Rate, 2004 Philippines – 10.9
Access to Safe Water, 2002Source: Data-APIS (Annual Poverty Indicator Survey), NSO Philippines – 80.0
Access to Safe Water, Region X, 2002Source: Data-APIS (Annual Poverty Indicator Survey), NSO Camiguin 97.8 Misamis Oriental 96.1 Misamis Occidental 78.2 Bukidnon 68.1 Lanao del Norte 86.8 Region X – 83.3
Access to Sanitary Toilet Facilities, 2002Source: Data-APIS (Annual Poverty Indicator Survey), NSO Philippines – 86.1
Access to Sanitary Toilet Facilities, 2002Source: Data-APIS (Annual Poverty Indicator Survey), NSO Camiguin 87.8 Misamis Occidental 86.1 Misamis Oriental 92.3 Bukidnon 75.8 Lanao del Norte 87.2 Region X – 85.3
Access to Electricity, 2002 Philippines – 79.0
Access to Electricity, 2002 Camiguin 63.7 Misamis Oriental 86.6 Misamis Occidental 75.5 Bukidnon 55.5 Lanao del Norte 75.4 Region X – 72.9
Infant Mortality Rate, 2003 Philippines – 30.0
Prevalence of Malnutrition Among 0-5 Year Old Children(International Standard), Philippines, 2003
Prevalence of Malnutrition Among 0-5 Year Old Children(International Standard), Philippines, 2001 Philippines – 30.6
Elementary Participation RateSY 2002-2003 Philippines – 90.3
Secondary Participation RateSY 2002-2003 Philippines – 58.3
Cohort Survival Rate, Elementary LevelSY 2002-2003 Philippines – 69.8
Cohort Survival Rate, Secondary LevelSY 2002-2003 Philippines – 65.8
Functional Literacy Rate, 2003 Philippines – 84.1