Download
1 / 44
440 likes | 635 Vues
10 Productivity and Food Webs in the Sea. Notes for Marine Biology: Function, Biodiversity, Ecology By Jeffrey S. Levinton. ©Jeffrey S. Levinton 2001. Productivity vs biomass. Biomass the mass of living material present at any time, expressed as grams per unit area or volume

E N D
10 Productivity and Food Webs in the Sea Notes for Marine Biology: Function, Biodiversity, Ecology By Jeffrey S. Levinton ©Jeffrey S. Levinton 2001
Productivity vs biomass Biomass the mass of living material present at any time, expressed as grams per unit area or volume Productivity is the rate of production of living material per unit time per unit area or volume
Productivity Primary productivity - productivity due to Photosynthesis Secondary productivity - productivity due to consumers of primary producers
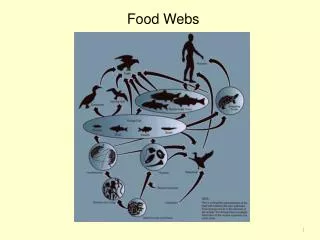
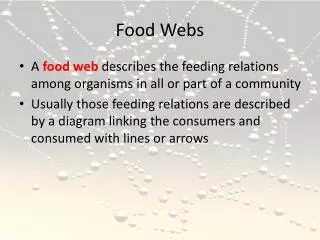
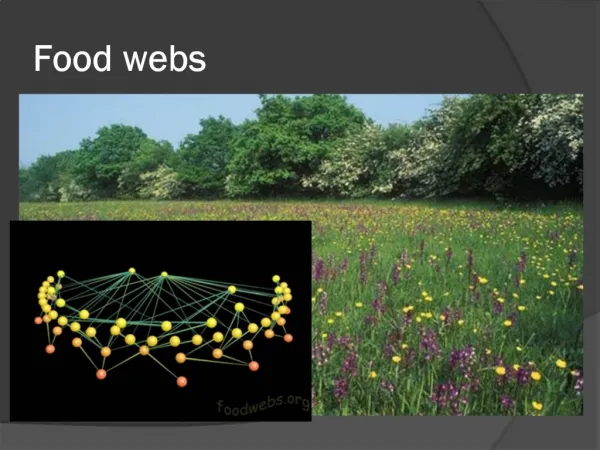
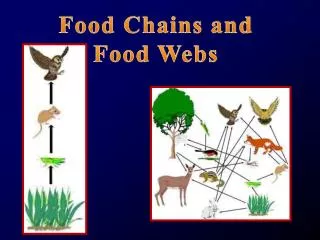
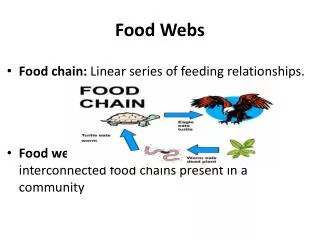
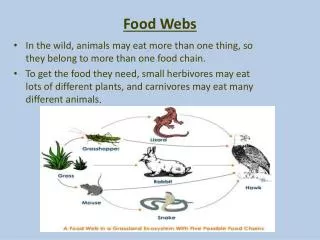
Food Chain Food chain - linear sequence showing which organisms consume which other organisms, making a series of trophic levels Food web - more complex diagram showing feeding relationships among organisms, not restricted to a linear hierarchy
Food Chain Abstraction Food chain Food Web Adult herring Herring Young herring amphipod arrowworm sand eel Copepod Larger copepod cladocerans Mollusk larvae Barnacle larvae tunicate Small copepods euphausid Phytoplankton Phytoplankton
Transfer Between Trophic Levels Transfer from one trophic level to the next is not complete: 1. Some material not eaten 2. Not all eaten is converted with 100% efficiency
Transfer Between Trophic Levels 2 Budget for ingested food (use energy units): I = E + R + G I amount ingested E amount egested R amount respired G growth (partitioned between somatic growth and reproduction)
Transfer Between Trophic Levels 3 Incomplete transfer up a food chain: Measure by food chain efficiency: E = amount extracted from a trophic level amount of energy supplied to that level Often in range of as little as 10%
Transfer Between Trophic Levels 4 Use food chain efficiency to calculate energy available to highest trophic level: P = BEn B = primary production P = production at highest level E = food chain efficiency N = number of links between trophic levels
Transfer Between Trophic Levels 4 Use food chain efficiency to calculate energy available to highest trophic level: P = BEn Let E = .1, B = 1, n = 2,3,4 If n = 2, P = ?
Transfer Between Trophic Levels 4 Use food chain efficiency to calculate energy available to highest trophic level: P = BEn Let E = .1, B = 1, n = 2,3,4 If n = 2, P = ? P = 1 x (0.1)2 = 1 x 0.01 = 0.01
Transfer Between Trophic Levels 4 Use food chain efficiency to calculate energy available to highest trophic level: P = BEn Let E = .1, B = 1, n = 2,3,4 If n = 3, P = ? P = 1 x (0.1)3 = 1 x 0.1 x 0.1 x 0.1 = 0.001
Transfer Between Trophic Levels 5 Use food chain efficiency to calculate energy available to highest trophic level: P = BEn With 5 trophic levels, a change of E from 0.1 to 0.2 magnifies P by a factor of 16
Oceanic Food Webs Food webs in the oceans vary systematically in food chain efficiency, number of trophic levels, primary production
Oceanic Food Webs Note: Great potential of upwelling areas due to combination of high primary production, higher food chain efficiency, lower number of trophic levels
Oceanic Food Webs Open ocean, gyre centers Shelf, upwelling Many trophic levels Few trophic levels Stable, low nutrient Turbulent, high nutrient
Measuring Primary Productivity Gross primary productivity - total carbon fixed during photosynthesis Net primary productivity - total carbon fixed during photosynthesis minus that part which is respired.
Measuring Primary Productivity 2 Net Primary productivity most interesting: gives that part of the production available to higher trophic levels
Measuring Primary Productivity 3 Oxygen technique - Principle - relies upon fact that oxygen is released during photosynthesis CO2 + 2H2O ---> (CH2O)n + H2O + O2
Measuring Primary Productivity 4 Oxygen technique 2 - there is an addition from photosynthesis and a subtraction from respiration
Measuring Primary Productivity 5 Oxygen technique3 - Measurement of oxygen: Winkler technique - chemical titration of Oxygen Polarographic oxygen electrode -
Measuring Primary Productivity 6 Oxygen technique 4 - Light-Dark bottle technique: Light bottle gives oxygen from photosynthesis minus oxygen consumed in respiration Dark bottle gives oxygen consumed from Respiration
Measuring Primary Productivity 7 Oxygen technique5 - Light-Dark bottle technique: Start light and dark bottles with water sample, wait a short amount of time At end of experiment: oxygen in light minus that in dark bottle gives you gross photosynthesis
Measuring Primary Productivity 8 Oxygen technique 6 - Light-Dark bottle technique: Get change of oxygen, but need to convert to units of carbon. If phytoplankton are synthesizing sugars, multiply change in oxygen atoms by 375 to get equivalent in carbon
Measuring Primary Productivity 9 Radiocarbon technique - Principle: carbon is taken up by cells During photosynthesis, so if you label that carbon you can trace it as it is incorporated into cells during photosynthesis.
Measuring Primary Productivity 10 Radiocarbon technique 2 - Method: add bicarbonate to solution With phytoplankton that is labeled with 14C
Measuring Primary Productivity 11 Radiocarbon technique 3 - Method: add bicarbonate to solution With phytoplankton that is labeled with 14C Incubate phytoplankton in the radiocarbon Solution Then filter phytoplankton and count radiocarbon Taken up by phytoplankton, using a scintillation counter
Measuring Primary Productivity 12 • Radiocarbon technique 4 - • Calculation: • Know the amount of bicarbonate that was in container 2. Know the amount of radiolabeled bicarbonate you added and the amount that was taken up by Phytoplankton • allows calculation of amount of bicarbonate taken up in photosynthesis
Measuring Primary Productivity 13 Radiocarbon technique 5 - Correction: 14C is taken up more slowly than much more common stable isotope 12C. Therefore, --> need to multiply results by 1.05 to get amount in photosynthesis
Measuring Primary Productivity 14 Radiocarbon technique 6 - What you get with this measure: Carbon incorporation into phytoplankton (net photosynthesis)
Measuring Primary Productivity 15 Compare Oxygen technique with radiocarbon: Oxygen technique - used where primary production is high in estuaries, shelf Radiocarbon technique - useful where primary production is low such as open ocean
Measuring Primary Productivity 16 Compare Oxygen technique with radiocarbon 2: Oxygen technique tends to give higher estimates of primary production, perhaps because cells are leaking sugars during photosynthesis, resulting in loss of radiocarbon when cells are filtered and counted
Measuring Primary Productivity 17 Satellite Approaches: Satellites can use photometers specific to wavelength to measure chlorophyll, Seawater temperature Need ground truthing to get relationship Between chlorophyll concentration and primary production; varies with region
Measuring Primary Productivity 18 Satellite Approaches 2: Satellites can use photometers specific to wavelength to measure chlorophyll, Seawater temperature Need ground truthing to get relationship Between chlorophyll concentration and primary production; varies with region
sun Satellite Color scanner Irradiance Radiance Phytoplankton
Geographic Variation of Productivity Continental shelf and open-ocean upwelling Areas are most productive 2. Convergences and fronts often are sites of rise of nutrient rich deep waters (e.g., shallow water seaward of slope 3. Central ocean, gyre centers are nutrient poor, low primary production
North Atlantic North Pacific Indian Ocean South Pacific South Atlantic Antarctic
Satellite image of world productivity, from SeaWiFS satellite