International Trade Dynamics
620 likes | 664 Vues
Explore recent examples like outsourcing and the impact on jobs and economies. Analyze how international trade influences working conditions and child labor. Dive into topics such as the European Union, China's currency revaluation, and trade theories.

International Trade Dynamics
E N D
Presentation Transcript
Recent examples Outsourcing (offshoring) – a new form of international trade Reduces costs of production (labour cost) Which kinds of jobs are affected? Which countries are affected? The case of India – advantages What is the extent of outsourcing? Government economic policy in cases of outsourcing?
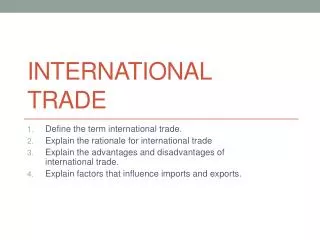
International trade, working conditions in developing countries and child labour Does international trade help improve working condition in LDCs? Does international trade contribute to an increase in child labour? Should we boycott imports from countries/companies that allow child labour How can we resolve the problem?
The European Union The euro – a supranational currency Advantages of a common currency Disadvantages? The experience of using the euro The geographic expansion of the European Union Requirements for joining the EU Benefits of joining the EU Costs?
China’s revalues its currency China’s fixed exchange rate was below market value, making Chinese imports cheaper and contributing to a trade deficit of the US with China To maintain the fixed exchange rate the Chinese government bought US dollars and sold yuan. These US $ were used to purchase US government bonds Was the yuan overvalued? China has a small trade surplus overal Saving rates in China are very high suggesting a surplus
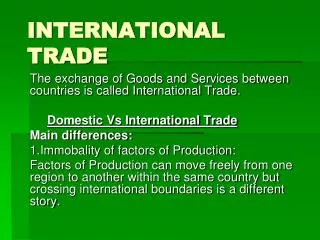
Why is int’l economics different No-one is in charge of the whole world economy in the sense that governments are in charge of the national economy Each country has its own currency and currency values fluctuate Each country has its own fiscal policy which causes movement of capital The factors of production are mobile across countries
INTERNATIONAL ECONOMICS 14th Edition Thomas A. Pugel McGraw-Hill Education
Peter H. Lindert Professor of Economics University of California, Davis
Thomas A. Pugel Professor of Economics and Global Business Stern School of Business New York University
Chapter 1 Introduction • What ? • Why ? • Contents • Study guide
1.1 International Economics 1.1.1 Economics 1.1.2 International Economics Economics for international economic relations • International trade • International Finance
1.2 Importance of the Subject Help us understand International economic relations
World trade value in 2008 Merchandise: US$16070 billion Services: US$3780 billion
World Trade Growth 2000-2008 Trade volume World Merchandise Export: 5% World Merchandise Production: 2.5% Trade value World Merchandise Export: 12% China’s Merchandise Export: 24% World Export in commercial services: 12% China’s Export in commercial services: 22%
Trade in goods • Primary goods 初级产品 • Manufactured products 工业制成品
What services are traded? Modes of supplying services: • Cross-border Supply 跨境提供 • Consumption Abroad 境外消费 • Commercial Presence 商业存在 • Presence of Natural Persons 自然人流动
What services are traded? • Business services (including professional services and computer services) • Communication services • Construction and related engineering services • Distribution services • Educational services • Environmental services
What services are traded? • Financial services (including insurance and banking) • Health-related and social services • Tourism and travel-related services • Recreational, cultural and sporting services • Transport services • Other services not included elsewhere
China’s ranks in world trade Leaders in world merchandise trade, 2005
China’s ranks in world trade Leaders in world service trade, 2005
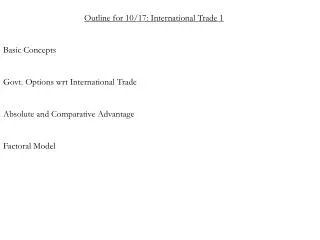
Part One The Theory of International Trade Chapters 2 – 6 Part Two International Trade Policy Chapters 7 – 14 1.3 International Trade : Contents
Part One Trade Theories Chapter 2 The Basic Theory Using Demand and Supply国际贸易的供求分析2004 China shoe industry Production : 7 billion pairs Consumption: 2 billion pairs Exports: 5 billion pairs2004 Crude oil 原油Production : 1.75 亿吨 Consumption: 2.9亿吨 Imports: 1.17亿吨
Chapter 3 Why Everybody Trades: Comparative Advantage 贸易的动因:比较优势 Comparative Advantage What is China’s Comparative Advantage?
Chapter 4 Trade: Factor Availablity and Factor Proportions Are Key 贸易的关键: 要素可获得性与要素比例 More Factors of Production H-O Theorem
China’s Comparative Advantage Labor-intensive products 劳动密集型产品 √ Capital-intensive products 资本密集型产品 ? Technology-intensive products 技术密集型产品 ╳
Can China produce and export large civil aircraft? Boeing Airbus
Chapter 5 Who Gains and Who loses from Trade? 国际贸易对福利的影响 Factor owners in exporting industries? Or those in importing industries?
Chapter 6 Scale Economies, Imperfect Competition, and Trade 规模经济、不完全竞争与贸易 • Intra-Industry Trade 产业内贸易 • Product differentiation 产品差异 • Economies of scale 规模经济
Chapter 7 Growth and Trade 经济增长与国际贸易 Immiserizing Growth 贫困化增长 Terms of Trade 贸易条件
中国汽车进口关税的调整 • 1994: 110 - 150% • 1997: 80 - 100% • 2002: 43.8 - 50.7% • 2003: 38.2%- 43% • 2004: 34.2%- 37.6% • 2005: 30% • 2006: 28%; July 1: 25%
Chapter 9 Nontariff Barriers to Imports 非关税贸易壁垒
Chapter 10 Arguments for and against Protection 支持和反对贸易保护的理由 • Infant industries 幼稚产业 • Sunset industries 夕阳产业 • Non-economics arguments 非经济理由
Chapter 11 Pushing Exports 出口促进措施 • Dumping 倾销 • Subsidies 补贴
Chapter 11 Trade Blocs and Trade Blocks 贸易集团与贸易禁运 • Some trade blocs • The European Union 欧盟 • NAFTA 北美自由贸易区 • ASEAN 东南亚国家联盟
Chapter 13 Trade and the Environment 贸易与环境