Matlab and Matrices
Dan Witzner Hansen Email : witzner@itu.dk. Matlab and Matrices. Matlab - Student Edition!!!!. Why Use MATLAB ?. Interactive System D ata processing P rogramming V isualization Basic element is an array E asy vector and matrix manipulation

Matlab and Matrices
E N D
Presentation Transcript
Dan Witzner Hansen Email: witzner@itu.dk Matlab and Matrices
Why Use MATLAB? • Interactive System • Data processing • Programming • Visualization • Basic element is an array • Easy vector and matrix manipulation • Lots of built in functions and code libraries • Implicit loops for arrays • Many preexisting functions • Filtering, converting, sorting, finding, means, minimum. • Lots of online material
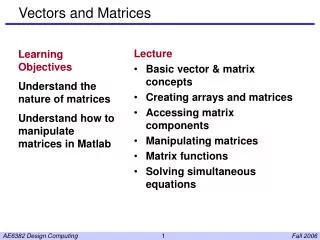
Avoid using too many libraries (and convert between formats) Easy to see the connection between code and mathematics (Matrix of doubles is the primitive type) Good plotting facilities (also for other courses) Programming is a little different from what you have tried before – in some sense a little more primitive :D Why is matlab relevant for you?
Why is Linear Algebra interesting? • It has many applications in many diverse fields. (computer graphics, chemistry, biology, differential equations, economics, business, ...) • It strikes a nice balance between computation and theory. • Essential the course
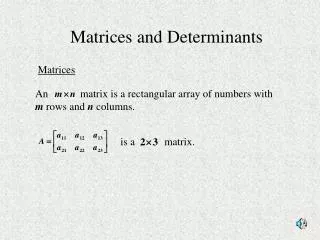
What is a Matrix? A matrix is a set of elements, organized into rows and columns rows columns
Matrix Examples Gender,age,height, weight Patient
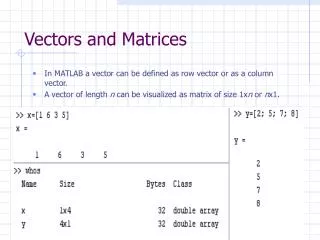
Vector Column vector (default): Row vector:
Addition: • Multiplication with scalar • Multiplication : • Inner product (“row times column”) • Outer product (“column times row”) Vector operators V+w av v w v
Matlab: Scalars, Vectors >> a = 5; >> b = [1 2 3 2 1]; >> c = [1:0.25:2]’ c = 1.00 1.25 1.50 1.75 2.00 >> c(5) = -10 c = -10.00 1.25 1.50 1.75 2.00 >> a*b >> c = [5 10 15 10 5] >> a-b ans = [4 8 12 8 4]
Norm / Length and orthogonality 2-Norm: >> x = [2 -5]; >> norm(x) ans = 5.3852 Orthogonal: Orthonormal: Orthogonal and ||x||=||y||=1
Matrix: Basic Operations • Addition, Subtraction, Multiplication
Operators and Matrix Operations • + - addition, subtraction • / ^ matrixmultiplication, division, power • * [ 2 x 3] * [3 x 2] = [2 x 2] • [ ] define matrix • .* ./ .^ arraymultiplication, division, power • (arrays must be the same size) • n’ transpose, complex conjugate • ; separate rows, non-echo end of line.
Entering Data - 2D Matrices >> c = [1 2 3; 4 5 6; 7 8 9] c = 1 2 3 4 5 6 7 8 9
Useful matrix initializers zeros(n,m) an n x m matrix of zeros ones(n,m) an n x m matrix of ones rand(n,m) an n x m matrix of uniformly distributed numbers randn(n,m) an n x m matrix of normally distributed numbers
Simple operators in Matlab >> c = [1 2 3; 4 5 6; 7 8 9]; >> d= [1 1 1; 2 2 2; 3 3 3]; Res = c*d’; M = c.*d; Add = c+d;
Operators and Matrix Operations : “all elements” of row, column or between 2 numbers. ( ) specify elements of a defined vector/matrix / A/B = (B'\A')'B'\A ^ z = x^y, x or y must be a scalar. X = A\B is the solution to the equation A*X = B (more about this next week)
Initializing matrices >> A = zeros (5,5) >> c = [5 10 15 10 5] >> A[1,:] = c; >> diag([1 2 3 4]) 1 0 0 0 0 2 0 0 0 0 3 0 0 0 0 4 >> eye(3) 1 0 0 0 1 0 0 0 1
Accessing Data - 2D Arrays • Extracting part of a matrix • ( ) specify elements of an array • , separates dimension • : entire row or column • Combining Arrays • Horizontal concatenation • no punctuation • vertical concatenation • ; separates arrays >> d = c(1:2,2:3) d = 4 7 5 8 >> e = [d d] e = 4 7 4 7 5 8 5 8 >> f = [d; d] f = 4 7 5 8 4 7 5 8 Vectors of indices
Accessing Data - 2D Arrays >> x = [3 2 0 1 5 4]; >> minx = min(x) minx = 0 >> y = sort(x) y = 0 1 2 3 4 5 >> find(x) ans = 1 2 4 5 6 >> i4 = find(x==4) i4 = 6 Functions for extracting data: min, max, mean, median, sort find
Array versus Matrix Operations >> a = [1 2 3 4 5]; >> b = a; >> >> c = a.*b c = 1 4 9 16 25 >> d = a*b’ d = 55 Array operations include an implicit loop through the entire array. The operation is repeated for each element in the array. The matrix operation does the linear algebra operation for the matrices.
Some Predefined Variables pi3.14159265 i,j sqrt(-1) imaginary unit eps 2.2204e-016 (small number, can also be set to a number) inf infinity (from 1/0) nan not-a-number (from 0/0)
The dot-M file • Commands can be entered one at a time on the command line within MATLAB • A series of commands (functions) can be entered into a dot-M file (name.m). • To run the set of command, just type the name of the dot-M file: • dot-M filenamet.m • execute commands >> name [a,b,c,d] = someFunction(x,y,z);
The shape of matlab program >>[A,B]= example1('Example 1',0.1,0,5,0.2,0,5); >> help example1 % example1.m % Comment lines start with the percent sign % This is an example function which takes 3 parameters modelname is a string with the % name of the model to be used in the title line. dx and dy are the intervals for the % x and y variables, which range in value from fromxmin to xmax or ymin to ymax. function [Value1,Value2]=example1(modelname,dx,xmin,xmax,dy,ymin,ymax); % Define x and y x = [xmin:dx:xmax]; y = [ymin:dy:ymax]; % Make a mesh out of x and y Call to the example1 function Comments and help file information Definition of a function same name as the filename Not always needed – scripts also possible
Some starter tips • MATLAB is case sensitive: • a and A are different. • Use a ; at the end of the line to stop commands from echoing to the screen • Use keys to scroll through previously entered commands and rerun. • Help / helpwinwill tell you how to use a function and what it does. (e.g. >> help plotor >>help ops). Help on toolbar
Basics of Programming in MATLAB For Loop default increments by 1 can define other increment for i = 1:0.1:n While Loop continues as long as boolean expression is true. n = 5 for i = 1:n a(i) = i + 2; end test = 1; cnt = 1; while (test ~= 0) b(cnt) = 1/test; test = test - 0.1; cnt = cnt + 1; end
Basics of Programming in MATLAB If - elseif - else can have several sequential boolean tests can use both else and elseif or just one. if a == 0 b = a; else b = 1/a; end if and(x > xmin,x < xmax) disp(‘x is within limits’); elseif (x > xmax) disp(‘x is too large’); elseif (x < xmin) disp(‘x is too small’); end
Saving data save creates matlab.mat with all variables in workspace save fname creates fname.mat with all variables save fname var1 var2 saves only variables var1 & var2 save fname.txt var1 -ascii -tabs -double saves var1 as a table of ASCII numbers called fname.txt
Inputting Data From File load file of ascii data in columns >> load filename data loaded into variable filename >> A = load(‘filename’); data loaded into variable A fscanf formatted ascii data fread binary data file fopen open files (for fscanf, fread) fclose closes files
Plotting - General Commands creates a new figure window defines multiple plots on a single page defines plot title text X,y,xaxes label text puts text at specified coordinates defines the axis limits creates a colorbar defines type of shading (faceted, flat, interp) use to define properties of the axis or figure returns handle to current plot axis returns handle to current figure figure subplot title Xlabel,ylabel Zlabel text axis colorbar shading set gca gcf
Lots of 2D Graphics Functions Plot loglog semilogx semilogy bar errorbar fplot hist polar rose stairs linear plot of lines, points or symbols log-log scale plot log (x-axis) - linear (y-axis) plot log (y-axis) - linear (x-axis) plot Linear plot with error bars Function plot histogram polar coordinate plot angular histogram plot stairstep plot
3D Graphics Functions Plot lines and points in 3D space Filled 3D polygons in 3D space contour data in 2D or 3D space checkerboard color plot in 2D vector plot in 2D or 3D Stream lines in 2D or 3D Mesh surface in 3D, with contours or zero plane. Shaded surface in 3D Display surface normal vectors. Generate a cylinder or sphere. plot3 fill3 contour,contour3 pcolor quiver, quiver3 stream, stream3 mesh, meshc, meshz surf, surfc, surfl surfnorm cylinder, sphere
Example: dot-M files, functions, plotting Cosine Curve
Example: dot-M files, functions, plotting >> example1('Example 1',0.1,0,5,0.2,0,5); >> help example1 % example1.m % Comment lines start with the percent sign % This is an example function which takes 3 parameters modelname is a string with the % name of the model to be used in the title line. dx and dy are the intervals for the % x and y variables, which range in value from fromxmin to xmax or ymin to ymax. function example1(modelname,dx,xmin,xmax,dy,ymin,ymax); % Define x and y x = [xmin:dx:xmax]; y = [ymin:dy:ymax]; % Make a mesh out of x and y [X,Y] = meshgrid(x,y); % takes vectors and repeats x for every y and y for every x. % Define a function for every x, y pair Z = sin(X).*cos(Y); whos X Y Z
Example: dot-M files, functions, plotting minz = min(min(Z)); maxz = max(max(Z)); save ex1dat X Y Z % saves variables in binary matlab format % Plotting figure; % opens a new figure window. subplot(2,3,1) % 6 plots in figure split into 2 rows and columns % 1- first plot is in top-left plot(X(1,:),Z(1,:),'r') % plot all the points in the % first column as a red line % (also b, g, y, c, m, k, w). title(['Plot 1: ' modelname]); xlabel('X'); ylabel('Z'); grid; % Plots grid lines axis([xmin-dxxmax+dxminzmaxz]);
Example: dot-M files, functions, plotting subplot(2,3,2) plot(Y(:,2),Z(:,2),'gx'); % plots points as green x's % (type 'help plot' for full list). vlab = input(‘Enter label: ‘,’s’); % get data from command line hold on; % allows you to overlay more % symbols, lines etc... plot(Y(:,4),Z(:,4),'ro'); plot(Y(:,6),Z(:,6),'m*'); title('Plot 2: plot symbols'); text(2,0.5,vlab); % add text labels xlabel('Y'); ylabel('Z'); grid; axis([ymin-dyymax+dyminzmaxz]); subplot(2,3,3) plot(Y,Z,'.-'); % plot all rows of X versus all rows of Z % -- dashed line, also -solid, : dotted, -.dash-dot % can also combine symbols and line 'o-; title('Plot 3: whole array'); xlabel('Y'); ylabel('Z'); grid; axis([ymin-2*dy ymax+2*dy 2*minz 2*maxz]);
Example: dot-M files, functions, plotting subplot(2,3,4) pcolor(X,Y,Z); shading flat; colorbar('horiz'); title('Plot 4: pcolor'); xlabel('X'); ylabel('Y'); subplot(2,3,5) meshc(X,Y,Z); shading flat; colorbar('horiz'); title('Plot 5: meshc'); xlabel('X'); ylabel('Y'); zlabel('Z') subplot(2,3,6) surfl(X,Y,Z); shading interp; colorbar; set(gca,'Zlim',[-2 2]); view(15,20); title('Plot 6: surfl'); xlabel('X'); ylabel('Y'); zlabel('Z')
Example: dot-M files, functions, plotting % Save data to ascii file as column data [nx,ny] = size(X); X = reshape(X,nx*ny,1); Y = reshape(Y,nx*ny,1); Z = reshape(Z,nx*ny,1); dat = [X Y Z]; keyboard; save ex1.asc dat -ascii Cosine Curve
Simple? figure(1) ; clft = linspace(0, 2*pi, 512) ; [u,v] = meshgrid(t) ; a = -0.2 ; b = .5 ; c = .1 ; n = 2 ; x = (a*(1-v/(2*pi)) .* (1+cos(u)) + c) .* cos(n*v) ; y = (a*(1-v/(2*pi)) .* (1+cos(u)) + c) .* sin(n*v) ; z = b*v/(2*pi) + a*(1-v/(2*pi)) .* sin(u) ; surf(x,y,z,y) shadinginterpaxisoffaxisequalcolormap(hsv(1024)) materialshinylightinggouraudlightangle(80, -40) lightangle(-90, 60) view([-150 10])
Reading and saving images easy (imread, imshow) • Often want to draw on top of an image • Hold (on/off) Images, plots & mouse inputs >> I = imread(‘GroundFloor.bmp’) >> figure(1) >> imshow(I); >> [X,Y,Z] = ginput(2) >> hold on >> plot(X,Y,’rx’,’MarkerSize’,10,’LineWidth’,3) >> hold off
Learning More • Remember the help / helpwin commands • MATLAB help pages: • describe how to use functions and gives examples • provides theory behind more complex functions • Getting Started • MATLAB Functions Listed by Category • MATLAB Functions Listed Alphabetically • MATLAB Reference Guide, User’s Guide • same as help pages, but in print -- sometimes nice to flip through when you’re not sure what you’re looking for
Try to get Matlab running • Take a look at a Matlab primer • Watch some movies – if you have not done so already • Next week: • More linear algebra • DON’T LET THAT DISCURAGE YOU Your First Assignment
Feel free to e-mail me at any time More questions?