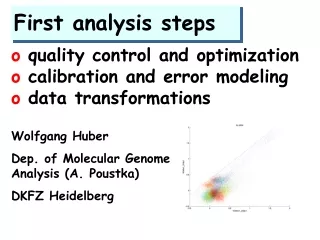
Meta Analysis First Steps
Meta Analysis First Steps. Data Analysis, Metric Generation and Extracted Pattern Annotation. Project Goals for Meta-Analysis. Subgoal #1 : Complete first statistical meta-analysis of ERP patterns from NEMO consortium datasets Target first paper submission by May 2009

Meta Analysis First Steps
E N D
Presentation Transcript
Meta Analysis First Steps Data Analysis, Metric Generation and Extracted Pattern Annotation
Project Goals for Meta-Analysis • Subgoal #1: Complete first statistical meta-analysis of ERP patterns from NEMO consortium datasets • Target first paper submission by May 2009 • Subgoal #2: Compare pattern mappings from different meta-analyses & establish functionally relevant links between patterns • Lexical, semantic, & memory-related ERP • Establish meaningful pattern classes, hierarchies based on meta analyses results
Meta Summary of ERP Data Meta Analysis Analyze Mark-up Label Cluster Link Label Linked Clusters Publish (rinse and repeat)
Meta Analysis Steps • Obtain ERP data sets with compatible functional constraints • NEMO consortium data • Decompose / segment the ERP data into discrete spatio-temporal patterns • PCA / ICA / Microstate Segmentation • Mark-up patterns with their categorical, functional and spatio-temporal characteristics • NEMOautolabel • Label patterns • Cluster patterns within data sets • Link labeled clusters across data sets • Label linked clusters • Publish
Techniques for Decomposing / Segmenting ERP Data Into Discrete Spatio-Temporal Patterns • Component Separation • PCA: Principal Components Analysis • Established protocol with supporting literature • Dien, Frishkoff, Kayser & Tenke • Applied to 9 consortium data sets from 3 separate labs • ICA: Independent Components Analysis • Established protocol with supporting literature, though less extensive than PCA ERP research • Makeig et al • Mixed results / interpretation difficulties w.r.t. consortium data • Automated Windowing / Microstate Segmentation • Established protocol with supporting literature • Lehman, Koenig, Murray • In progress: currently adding to NEMOautolabel
Microstate Segmentation OverviewSimulated Microstates • Simulated data set of 4 distinct, finite duration, topographies (microstates). Note topographies are partially overlapping
Microstate Segmentation OverviewMicrostate Boundaries • Microstate border probability function (MSBPF): Quantifies probability of topographic change as a function of time
Overview of PCA • Temporal PCA • Variables: Time samples • Observations: Channel waveforms across conditons + subjects • Relationship matrix quantifies temporal correlations Basis of approach for decomposing and statistically quantifying NEMO consortium data • Spatial PCA • Variables: Channel locations • Observations: Spatial topographies across conditons + subjects • Relationship matrix quantifies spatial correlations • Problematic due to high spatial overlap of patterns from volume conduction Not used due to concerns of misallocation of variance / factor splitting
PCA Decomposition Protocolfor Analysis of Consortium Data • Dien PCA Toolbox / ERP Toolkit • ReadSegRaw / PCAtoRaw to import from and export to EGI segmented simple-binary files • Temporal PCA algorithms • Covariance relationship matrix • Kaiser factor loading normalization • Retain all factors prior to any and all rotations • Varimax rotation followed by Promax relaxation • Statistically analyze 25 post-rotation factors, sorted in order of decreasing projected variance (based on FacVar)
PCAtoRaw / ERP PCA Toolbox • PCAtoRaw run-time parameters • PCAtoRaw invokes Dien ERP PCA Toolbox
PCAtoRaw / ERP PCA Toolbox • Npraw data PCA decomposition summary
PCA Decomposition ProtocolFactor Retention – Part I • Pre-rotation factor retention • “The problem of the number of components” • Scree test • Linear scale may underestimate factor retention • Parallel test • Compare scree of experimental data to scree of random data of equal dimensions • Full pre-rotation retention • Kayser & Tenke proposal • Factor retention, pre-rotation, affects both explained variance and rotation outcome • Full pre-rotation retention eliminates effect of retention subjectivity on rotation outcome
PCA Decomposition ProtocolFactor Retention – Part 2 • Post-rotation factor retention • Determine number of retained components for adequate reconstruction of scalp recorded ERP • Retained components represent majority of ERP variance • Factors are sorted on FacVar, the fraction of data variance accounted for by each individual factor • Default post-rotation sort order of ERP PCA Toolkit • Statistical analysis, via NEMOautolabel, performed on retained factors • Flag retained factors with “robust” variance or high relative Global Field Power • Flag retained factors containing spatiotemporal characteristics of target patterns
PCAtoRaw / ERP PCA ToolboxNPraw.raw Test Dataset Results • PCAtoRaw output files: • .log: Summary run statistics • .mat: MATLAB workspace variables • .fig: Pre- and post-rotation factor scree plots • .raw: Factor loadings projected back to channel space • One set for each conditon / cell • Grand average (_G.raw) or subject-specific (_S##.raw)
PCAtoRaw / ERP PCA ToolboxNPraw.raw Test Dataset Results • Examine NPraw_G.raw factor waveforms, in scalp-surface space, at each channel across conditions (TopoPlot Mode) Factor 1 waveforms (0-900ms; 0.1uv/mm). Note condition effects / factor separation at centropariertal and anterior ventral sites
PCAtoRaw / ERP PCA ToolboxNPraw.raw Test Dataset Results • Examine NPraw_G.raw factor topographies, in scalp-surface space, at peak intensity across conditions (TopoMap Mode) Factor 1 scalp-surface topographies, 600ms post-stimulus, for the 4 NPraw experimental conditions (L to R): ConFinal, ConMid, InconFinal, InconMid
NEMOautolabelMarking up ERP Components / Microstates: NEMO_data • Mark-up observed patterns (components / microstates) with user-specified information on the experimental procedure and subject group • Each mark-up element (NEMOautolabel label) has a unique NEMOautolabel ID and will map to a corresponding element in the NEMO ontology NEMOautolabel_Name NEMOautolabel_Def NEMOautolabel_ID NEMOlex_Name NEMOlex_ID ExptID ExptID represents "experiment ID" and specifies the experimental procedure and subject group. AL:0000003 experiment_id NM:0000059
NEMOautolabelMarking up ERP Components / Microstates: NEMO_data • Mark-up observed patterns (components / microstates) with their temporal characteristics • MATLAB-based functions extract temporal metrics for each condition, subject and component / microstate • Data driven • Harnesses expert-knowledge: Domain experts specify the temporal characteristics of interest NEMOautolabel_Name NEMOautolabel_Def NEMOautolabel_ID NEMOlex_Name NEMOlex_ID Ti_Max Ti_Max specifies for each temporal component the time point of its peak absolute intensity, in milliseconds. AL:0000019 ERP_pattern_peak_latency NM:0000047
NEMOautolabelMarking up ERP Components / Microstates: NEMO_data • Mark-up observed patterns (components / microstates) with their spatial characteristics • MATLAB-based functions extract spatial metrics for each condition, subject and component / microstate • Data driven • Harnesses expert-knowledge: Domain experts specify the spatial characteristics of interest NEMOautolabel_Name NEMOautolabel_Def NEMOautolabel_ID NEMOlex_Name NEMOlex_ID ITTCh_COP International 10-10 electrode location closest to the component pair's center-of-positivity xy-coordinate pair (COP_X2d, COP_Y2d), in L2-norm, on a montage-specific 2-D flat map of scalp-surface electrode locations. AL:0000036 TBA TBA
References PCA Dien, J. (1998). Addressing misallocation of variance in principal components analysis of event-related potentials. Brain Topogr, 11(1), 43-55. Dien, J., & Frishkoff, G. A. (2005). Introduction to principal components analysis of event-related potentials. In T. Handy (Ed.), Event-Related Potentials: A Methods Handbook. (pp. 189-208). Cambridge, MA: MIT Press. Dien, J., Beal, D. J., & Berg, P. (2005). Optimizing principal components analysis of event-related potentials: matrix type, factor loading weighting, extraction, and rotations. Clin Neurophysiol, 116(8), 1808-1825. Dien, J. (2006). Progressing towards a consensus on PCA of ERPs. Clin Neurophysiol, 117(3), 699-702; author reply 703-697. Dien, J., Khoe, W., & Mangun, G. R. (2007). Evaluation of PCA and ICA of simulated ERPs: Promax vs. Infomax rotations. Hum Brain Mapp, 28(8), 742-763. Dien, J. (2009). Evaluating two-step PCA of ERP data with Geomin, Infomax, Oblimin, Promax, and Varimax rotations. Psychophysiology. Kayser, J., & Tenke, C. E. (2003). Optimizing PCA methodology for ERP component identification and measurement: theoretical rationale and empirical evaluation. Clin Neurophysiol, 114(12), 2307-2325. Kayser, J., & Tenke, C. E. (2005). Trusting in or breaking with convention: towards a renaissance of principal components analysis in electrophysiology. Clin Neurophysiol, 116(8), 1747-1753.
References ICA Dien, J., Khoe, W., & Mangun, G. R. (2007). Evaluation of PCA and ICA of simulated ERPs: Promax vs. Infomax rotations. Hum Brain Mapp, 28(8), 742-763. Microstate Analysis Michel, C. M., Murray, M. M., Lantz, G., Gonzalez, S., Spinelli, L., & Grave de Peralta, R. (2004). EEG source imaging. Clin Neurophysiol, 115(10), 2195-2222. Murray, M. M., Brunet, D., & Michel, C. M. (2008). Topographic ERP analyses: a step-by-step tutorial review. Brain Topogr, 20(4), 249-264. Koenig, T., Kochi, K., & Lehmann, D. (1998). Event-related electric microstates of the brain differ between words with visual and abstract meaning. Electroencephalogr Clin Neurophysiol, 106(6), 535-546. Koenig, T., & Lehmann, D. (1996). Microstates in language-related brain potential maps show noun-verb differences. Brain Lang, 53(2), 169-182. Lehman, D., & Skrandies, W. (1985). Spatial analysis of evoked potentials in man - A review. Progress in Neurobiology, 23, 227-250. Pizzagalli, D., Lehmann, D., Koenig, T., Regard, M., & Pascual-Marqui, R. D. (2000). Face-elicited ERPs and affective attitude: brain electric microstate and tomography analyses. Clin Neurophysiol, 111(3), 521-531.
References Annotating functional attributes Fox, P. T., Laird, A. R., Fox, S. P., Fox, P. M., Uecker, A. M., Crank, M., et al. (2005). BrainMap taxonomy of experimental design: description and evaluation. Hum Brain Mapp, 25(1), 185-198. Spatial & temporal metric generation Handy, T. (2005). Basic Principles of ERP Quantification. In T. Handy (Ed.), Event-Related Potentials: A Methods Handbook (pp. 33–56). Cambridge, MA: MIT Press. Luck, S. (2005). An Introduction to the Event-Related Potential Technique Boston, MA: The MIT Press. Otten, L. J., & Rugg, M. D. (2005). Interpreting Event-Related Brain Potentials. In T. Handy (Ed.), Event-Related Potentials: A Methods Handbook (pp. 3–16). Cambridge, MA: MIT Press. Picton, T. W., Bentin, S., Berg, P., Donchin, E., Hillyard, S. A., Johnson, R., Jr., et al. (2000). Guidelines for using human event-related potentials to study cognition: recording standards and publication criteria. Psychophysiology, 37(2), 127-152.