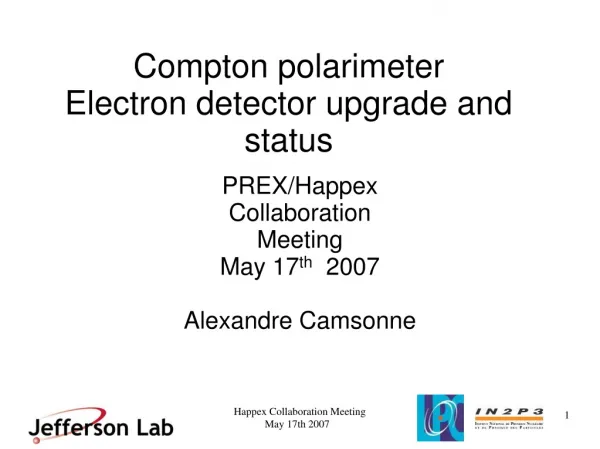
Compton imaging with the PORGAMRAYS detector
Compton imaging with the PORGAMRAYS detector. D S Judson. UNTF Forum 2010 - Salford. Outline. The Compton imaging process The PORGAMRAYS project What is it? How does it work? Detector description Spectroscopic performance GEANT simulations Experimental Compton imaging performance

Compton imaging with the PORGAMRAYS detector
E N D
Presentation Transcript
Compton imaging with thePORGAMRAYS detector D S Judson UNTF Forum 2010 - Salford
Outline • The Compton imaging process • The PORGAMRAYS project • What is it? • How does it work? • Detector description • Spectroscopic performance • GEANT simulations • Experimental Compton imaging performance • Summary
Scatters ) Where and E0 = E1 + E2 θ Absorbed E1 x1,y1,z1 E2 x2,y2,z2 γ-ray source E0
Cone of possible source location ) θ E1 x1,y1,z1 E2 x2,y2,z2
Compton imaging process • Projection of many cones gives position information • Area of greatest overlap gives source location 10 events 100 events 1 event
PORGAMRAYS – What is it? Portable Gamma-Ray Spectrometer The project aims to develop a gamma-ray spectrometer that is • Handheld and battery operated • Able to work at room temperature – no cooling • Durable, for use in hostile environments • Capable of providing • Energy resolution (for isotope identification) • Imaging (for location information) Potential applications for this unique sensor include: decommissioning, security and safety monitoring
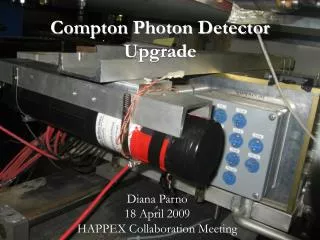
PORGAMRAYS – How does it work? • Good spectroscopic performance at room temperature? – Cadmium Zinc Telluride (CZT) detectors • Source location information? – Compton imaging • Compton imaging requires good knowledge of the position of the gamma-ray interaction within the detector? – Pixelated detectors • Useful over a wide range of energies? - Stack of thin detectors
PORGAMRAYS CZT detectors • Dimensions of 20 x 20 x 2 mm • Pixelated (10 x 10) • 2 x 2 x 2 mm voxels
PORGAMRAYS CZT detectors • Dimensions of 20 x 20 x 2 mm • Pixelated (10 x 10) • 2 x 2 x 2 mm voxels • Detector bonded to daughter board • Data read out through NUCAM II ASICS [1] • Energy range 0f 350 keV [1] P Seller et. al., IEEE Nuclear Symposium Conf. Rec., V6, 3786, ‘06
PORGAMRAYS – The solution Compton imaging using a stack of thin pixelated CZT detectors • 6 or 7 detectors • Modular • ASIC readout • Energy range • 60 – 2000 keV
The PORGAMRAYS demonstrator • Two CZT detectors • Running from external power supplies • Mechanically damped housing to avoid microphonics problems
Spectroscopic performance of CZT • At 60 keV (241Am), FWHM ~ 6 keV, noise ~ 20 keV
Geant4 simulations • Simulated two CZT detectors with 5 mm separation • Two different gamma-ray energies were 121 and 356 keV • Spectroscopic and imaging data used to evaluated the potential of the device
Geant4 simulations 121 keV γ-rays deposit little energy in the scatter detector Scatterer 0 20 40 60 80 100 120 140 160 180 200 Eγ (keV) Eγ (keV) Absorber
Geant4 simulations 356 keV γ-rays deposit 140-220 keV in each detector Scatterer 0 50 100 150 200 250 300 350 400 Eγ (keV) Absorber
Compton images - simulated 15 keV energy resolution, 2 mm position resolution (356 keV) 5 keV energy resolution, 2 mm position resolution Source located at x = 110 mm y = 110 mm FWHM X = 25 mm FWHM Y = 24 mm y (mm) x (mm)
Compton images – real data Source located at x = 100 mm y = 115 mm Point source 40 mm from the scattering detector’s surface FWHM ~ 25 keV y (mm) x (mm)
Compton images – real data Source located at x = 97 mm y = 100 mm Point source 40 mm from the scattering detector’s surface FWHM ~ 25 keV y (mm) x (mm)
Compton images – real data Possible to resolve changes in source position of only a few mms x = 115 mm x = 100 mm x position (mm)
Simulated V’s real images Simulated Real 5 keV energy resolution, 2 mm position resolution
Conclusions • A CZT based Compton camera has been developed • Energy resolution of ~ 10 % at 60 keV • Imaging algorithm have been developed and employed • Image resolution of ~ 20 mm FWHM has been demonstrated • Changes in position of ~ 10 mm can easily be resolved • Geant simulations have been performed and validated
Collaborators A J Boston1, P J Coleman-Smith2, D M Cullen3, A Hardie4, L J Harkness1, L L Jones4, M Jones1, I Lazarus2, P J Nolan1, V Pucknell2, S V Rigby1, P Seller4, J Simpson2, M Slee1 1 The University of Liverpool 2 STFC Daresbury Laboratory 3 The University of Manchester 4 STFC Rutherford Appleton Laboratory