Download
1 / 34
370 likes | 645 Vues
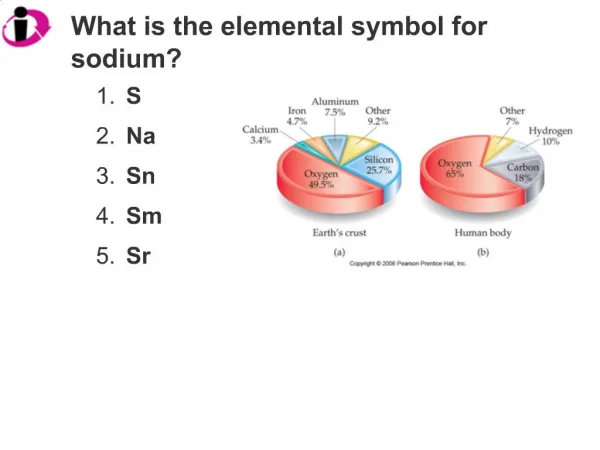
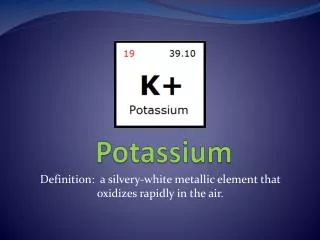
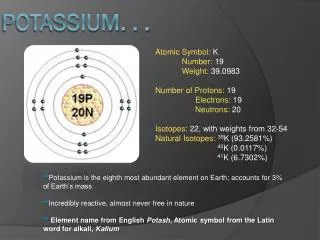
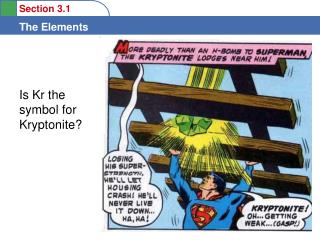
Why is potassium represented by the symbol K ?. In Latin and German, K alium = Potassium. 39 K is the dominant isotope. 40 K (radioactive) and 41 K (stable) are used as tracers. 1 kg/ha = 0.89 lbs/ac.

E N D
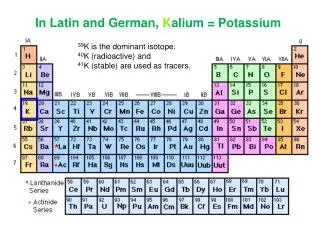
Why is potassium represented by the symbol K ? In Latin and German, Kalium = Potassium 39K is the dominant isotope. 40K (radioactive) and 41K (stable) are used as tracers.
1 kg/ha = 0.89 lbs/ac The total potassium content of most mid-west soils is high (generally higher than all other nutrients) but most of the K is locked up in minerals like K feldspar that release K very slowly
Important potassium concepts No significant gaseous forms 3rd most likely (after N and P) to be plant limiting Non-toxic at high concentrations Does not promote eutrophication (unlike N and P)
Slowly Available K Available K Unavailable K What Happens to Fertilizer K? • 20 to 60% of applied K is absorbed by crop in year 1 • Highest recovery on low K soils
K = K+ K fixation
Unavailable (90 to 98%) K+ K+ K K+ Soil solution K Soil Minerals (feldspar, mica) K+ K K K Readily available (0.1 to 2%) K+ K+ K+ K+ Soil Colloid SoilColloid Trapped K K+ K+ K+ K+ Soil Colloid Slowly available (1 to 10%)
Role of potassium in plant nutrition Remains in ionic form inside plants (rather than being incorporated into organic molecules) Very important osmotic regulator (lowers water potential inside of plant cells) Activator of over 80 enzymes 1-4% of plant dry matter (similar to N) Important for tolerance of environmental and biotic stresses (drought tolerance, winter hardiness, resistance to fungal pathogens, resistance to insects) Important for crop quality (flavor, color, stem strength)
Necrotic leaf margins are associated with severe potassium deficiency
K deficiency symptoms can occur even when soil test K levels are high Corn in ridge-till and no-till systems are often first to show K deficiency symptoms, but they can occur in other tillage systems as well. Uptake of K by plants requires an active root system, especially in the soil zone where plant-available K is located !! When this soil zone is dry, uptake is limited. Anything that exerts additional stress or limits root growth--compacted soil layers, root pruning, side-wall smearing--further reduces K uptake, especially when root growth is restricted in the zones of highest available K.
Average K2O application rates for fruit and vegetable crops in the US
Maintenance rates of P2O5 and K2O for agronomic crops
The more highly weathered soils in southern IL tend to have low CECs. Pockets of sandy soils (grey shaded areas) in northern and central IL also have low CECs • Most soils in the “high” region shown on this slide have CECs • > 12 meq / 100 g. • Most soils in the “low” region shown on this slide have CECs • < 12 meq / 100 g. • The U of I recommends different K management strategies for low and high CEC soils.
Crop response to extractable K in high CEC soils Crop response to extractable K in low CEC soils Sufficiency No maintenance
K fertilizer is cheap relative to grain prices K fertilizer is expensive relative to grain prices
Percent of soils testing medium or lower in K in 2001. BC AB MB 66 SK 33 15 ON PQ 19 PEI 47 45 WA NB 19 44 ME 56 7 MT ND 4 NS 90 MN OR VT 34 42 22 ID NH 5 NY 24 35 WI 41 SD 75 MI MA WY 68 CT 18 37 RI 60 IA 47 6 PA NE NJ NV IL IN OH 54 71 62 MD 3 12 UT DE 55 27 WV CO VA MO 10 80 12 CA 55 52 KS 44 29 KY 51 69 51 NC TN OK AZ NM 52 AR SC 51 68 11 26 MS AL GA 38 44 60 TX LA 57 39 North America 43% FL 72
No obvious downward trend despite deficit spending In 2005, US farmers applied only 75% as much phosphorus as their crops removed —and just slightly over 50% as much potassium. What are the long term consequences ???
Soil testing methods used by US labs for potassium in 2005
Soil test K = 224 ppm Soil test K = 112 ppm
General rule of thumb: 4 lbs of K2O are required to raise extractable K by 1 lb
Does Cation Balance Matter? The relative concentration of potassium, calcium, magnesium, ammonium, and other positively charged ions in the soil solution influences their relative uptake. Excessively high concentrations of one cation often results in inadequate uptake of other cations. For example, very high concentrations of calcium reduce uptake of potassium and very high concentrations of potassium reduce magnesium uptake. Does Cation Balance Matter? The relative concentration of potassium, calcium, magnesium, ammonium, and other positively charged ions in the soil solution influences their relative uptake. Excessively high concentrations of one cation often results in inadequate uptake of other cations. For example, very high concentrations of calcium reduce uptake of potassium and very high concentrations of potassium reduce magnesium uptake. http://www.pda.org.uk/leaflets/6/no6-print.htm Grass tetany Cation balance affects animal health
It’s well documented that alfalfa will take-up K beyond its needs if high levels of soil or applied K are available. This is referred to as “luxury consumption”.
Soil test values for K fluctuate during the year K is more available in wet soils
Potassium Fertilizers “Potash” = muriate of potash = MOP = 0 - 0 - 60 guaranteed analysis Used in organic agriculture
The chloride in MOP has negative effects on some crops Tobacco fertilized with MOP produces cured leaves with muddy and uneven color with excessive hygroscopicity and poor burn.
Potash ore is a mix of KCl, NaCl and other salts. The KCl is concentrated using a flotation process which skims off the surface of a fluid suspension of finely crushed ore. This concentrate is further processed and screened. The resulting fertilizer material is ~ 95 percent MOP. It is reddish in color because iron impurities in the ore are not removed in this process. White potash is produced by a process of dissolution and recrystallization. Potash ore is dissolved under pressure in hot brine, and MOP is precipitated as the brine cools and pressure reduces. The iron is removed in this process, and the resulting MOP fertilizer is white. White MOP is generally at least 98 percent potassium chloride.
PotashCorp produces 23% of the world's supply of potash. It also controls almost all of the world's unused supply, and has historically held back production to keep potash prices high. It is also the world's largest fertilizer producer #1 in potash, #3 in phosphate and #4 in nitrogen fertilizers