Download
1 / 50
530 likes | 933 Vues
Properties of Quadratic Functions in Standard Form. Warm Up. Lesson Presentation. Lesson Quiz. Holt McDougal Algebra 2. Holt Algebra 2. Warm Up Give the coordinate of the vertex of each function. 1. f ( x ) = ( x – 2) 2 + 3. (2, 3). 2. f ( x ) = 2( x + 1) 2 – 4. (–1,–4).

E N D
Properties of Quadratic Functions in Standard Form Warm Up Lesson Presentation Lesson Quiz Holt McDougal Algebra 2 Holt Algebra 2
Warm Up Give the coordinate of the vertex of each function. 1.f(x) = (x – 2)2 + 3 (2, 3) 2.f(x) = 2(x + 1)2 – 4 (–1,–4) 3.Give the domain and range of the following function. {(–2, 4), (0, 6), (2, 8), (4, 10)} D:{–2, 0, 2, 4}; R:{4, 6, 8, 10}
Objectives Define, identify, and graph quadratic functions. Identify and use maximums and minimums of quadratic functions to solve problems.
Vocabulary axis of symmetry standard form minimum value maximum value
When you transformed quadratic functions in the previous lesson, you saw that reflecting the parent function across the y-axis results in the same function.
This shows that parabolas are symmetric curves. The axis of symmetry is the line through the vertex of a parabola that divides the parabola into two congruent halves.
Identify the axis of symmetry for the graph of . Example 1: Identifying the Axis of Symmetry Rewrite the function to find the value of h. Because h = –5, the axis of symmetry is the vertical line x = –5.
Example 1 Continued Check Analyze the graph on a graphing calculator. The parabola is symmetric about the vertical line x = –5.
Check It Out! Example1 Identify the axis of symmetry for the graph of Rewrite the function to find the value of h. f(x) = [x - (3)]2 + 1 Because h = 3, the axis of symmetry is the vertical line x = 3.
Check It Out! Example1 Continued Check Analyze the graph on a graphing calculator. The parabola is symmetric about the vertical line x = 3.
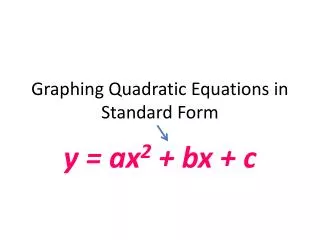
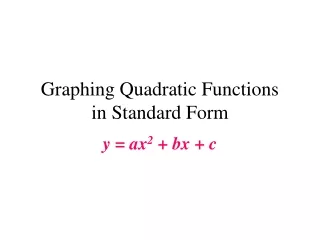
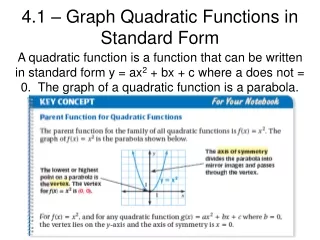
Another useful form of writing quadratic functions is the standard form. The standard form of a quadratic function is f(x)= ax2 + bx + c, where a≠ 0. The coefficients a, b, and c can show properties of the graph of the function. You can determine these properties by expanding the vertex form. f(x)= a(x – h)2 + k f(x)= a(x2 – 2xh +h2)+ k Multiply to expand (x –h)2. f(x)= a(x2) – a(2hx)+ a(h2) + k Distribute a. f(x)= ax2 + (–2ah)x+ (ah2 + k) Simplify and group terms.
a in standard form is the same as in vertex form. It indicates whether a reflection and/or vertical stretch or compression has been applied. a = a
Solving for h gives . Therefore, the axis of symmetry, x = h, for a quadratic function in standard form is . b =–2ah
Notice that the value of c is the same value given by the vertex form of f when x = 0: f(0) = a(0 – h)2 + k = ah2 + k. So c is the y-intercept. c = ah2 + k
These properties can be generalized to help you graph quadratic functions.
Helpful Hint When a is positive, the parabola is happy (U). When the a negative, the parabola is sad ( ). U
The axis of symmetry is given by . Example 2A: Graphing Quadratic Functions in Standard Form Consider the function f(x) = 2x2 – 4x + 5. a. Determine whether the graph opens upward or downward. Because a is positive, the parabola opens upward. b. Find the axis of symmetry. Substitute –4 for b and 2 for a. The axis of symmetry is the line x = 1.
Example 2A: Graphing Quadratic Functions in Standard Form Consider the function f(x) = 2x2 – 4x + 5. c. Find the vertex. The vertex lies on the axis of symmetry, so the x-coordinate is 1. The y-coordinate is the value of the function at this x-value, or f(1). f(1) = 2(1)2 – 4(1) + 5 = 3 The vertex is (1, 3). d. Find the y-intercept. Because c = 5, the intercept is 5.
Example 2A: Graphing Quadratic Functions in Standard Form Consider the function f(x) = 2x2 – 4x + 5. e. Graph the function. Graph by sketching the axis of symmetry and then plotting the vertex and the intercept point (0, 5). Use the axis of symmetry to find another point on the parabola. Notice that (0, 5) is 1 unit left of the axis of symmetry. The point on the parabola symmetrical to (0, 5) is 1 unit to the right of the axis at (2, 5).
The axis of symmetry is given by . Example 2B: Graphing Quadratic Functions in Standard Form Consider the function f(x) = –x2 – 2x + 3. a. Determine whether the graph opens upward or downward. Because a is negative, the parabola opens downward. b. Find the axis of symmetry. Substitute –2 for b and –1 for a. The axis of symmetry is the line x = –1.
Example 2B: Graphing Quadratic Functions in Standard Form Consider the function f(x) = –x2 – 2x + 3. c. Find the vertex. The vertex lies on the axis of symmetry, so the x-coordinate is –1. The y-coordinate is the value of the function at this x-value, or f(–1). f(–1) = –(–1)2 – 2(–1) + 3 = 4 The vertex is (–1, 4). d. Find the y-intercept. Because c = 3, the y-intercept is 3.
Example 2B: Graphing Quadratic Functions in Standard Form Consider the function f(x) = –x2 – 2x + 3. e. Graph the function. Graph by sketching the axis of symmetry and then plotting the vertex and the intercept point (0, 3). Use the axis of symmetry to find another point on the parabola. Notice that (0, 3) is 1 unit right of the axis of symmetry. The point on the parabola symmetrical to (0, 3) is 1 unit to the left of the axis at (–2, 3).
b. The axis of symmetry is given by . Check It Out! Example 2a For the function, (a) determine whether the graph opens upward or downward, (b) find the axis of symmetry, (c) find the vertex, (d) find the y-intercept, and (e) graph the function. f(x)= –2x2 – 4x a. Because a is negative, the parabola opens downward. Substitute –4 for b and –2 for a. The axis of symmetry is the line x = –1.
Check It Out! Example 2a f(x)= –2x2 – 4x c. The vertex lies on the axis of symmetry, so the x-coordinate is –1. The y-coordinate is the value of the function at this x-value, or f(–1). f(–1) = –2(–1)2 – 4(–1) = 2 The vertex is (–1, 2). d. Because c is 0, the y-intercept is 0.
Check It Out! Example 2a f(x)= –2x2 – 4x e. Graph the function. Graph by sketching the axis of symmetry and then plotting the vertex and the intercept point (0, 0). Use the axis of symmetry to find another point on the parabola. Notice that (0, 0) is 1 unit right of the axis of symmetry. The point on the parabola symmetrical to (0,0) is 1 unit to the left of the axis at (0, –2).
b. The axis of symmetry is given by . The axis of symmetry is the line . Check It Out! Example 2b For the function, (a) determine whether the graph opens upward or downward, (b) find the axis of symmetry, (c) find the vertex, (d) find the y-intercept, and (e) graph the function. g(x)= x2 + 3x – 1. a. Because a is positive, the parabola opens upward. Substitute 3 for b and 1 for a.
c. The vertex lies on the axis of symmetry, so the x-coordinate is . The y-coordinate is the value of the function at this x-value, or f(). f( ) = ( )2 + 3( ) – 1 = The vertex is ( , ). Check It Out! Example 2b g(x)= x2 + 3x – 1 d. Because c = –1, the intercept is –1.
Check It Out! Example2 e. Graph the function. Graph by sketching the axis of symmetry and then plotting the vertex and the intercept point (0, –1). Use the axis of symmetry to find another point on the parabola. Notice that (0, –1) is 1.5 units right of the axis of symmetry. The point on the parabola symmetrical to (0, –1) is 1.5 units to the left of the axis at (–3, –1).
Substituting any real value of x into a quadratic equation results in a real number. Therefore, the domain of any quadratic function is all real numbers. The range of a quadratic function depends on its vertex and the direction that the parabola opens.
Caution! The minimum (or maximum) value is the y-value at the vertex. It is not the ordered pair that represents the vertex.
Example 3: Finding Minimum or Maximum Values Find the minimum or maximum value of f(x) = –3x2 + 2x – 4. Then state the domain and range of the function. Step 1 Determine whether the function has minimum or maximum value. Because a is negative, the graph opens downward and has a maximum value. Step 2 Find the x-value of the vertex. Substitute 2 for b and –3 for a.
Step 3 Then find the y-value of the vertex, The maximum value is . The domain is all real numbers, R. The range is all real numbers less than or equal to Example 3 Continued Find the minimum or maximum value of f(x) = –3x2 + 2x – 4. Then state the domain and range of the function.
Example 3 Continued Check Graph f(x)=–3x2 + 2x – 4 on a graphing calculator. The graph and table support the answer.
Check It Out!Example 3a Find the minimum or maximum value of f(x) = x2 – 6x + 3. Then state the domain and range of the function. Step 1 Determine whether the function has minimum or maximum value. Because a is positive, the graph opens upward and has a minimum value. Step 2 Find the x-value of the vertex.
Step 3 Then find the y-value of the vertex, Check It Out!Example 3a Continued Find the minimum or maximum value of f(x) = x2 – 6x + 3. Then state the domain and range of the function. f(3) = (3)2 – 6(3) + 3 = –6 The minimum value is –6. The domain is all real numbers, R. The range is all real numbers greater than or equal to –6, or {y|y ≥ –6}.
Check It Out!Example 3a Continued Check Graph f(x)=x2 – 6x + 3 on a graphing calculator. The graph and table support the answer.
Check It Out!Example 3b Find the minimum or maximum value of g(x) = –2x2 – 4. Then state the domain and range of the function. Step 1 Determine whether the function has minimum or maximum value. Because a is negative, the graph opens downward and has a maximum value. Step 2 Find the x-value of the vertex.
Step 3 Then find the y-value of the vertex, Check It Out!Example 3b Continued Find the minimum or maximum value of g(x) = –2x2 – 4. Then state the domain and range of the function. f(0) = –2(0)2 – 4 = –4 The maximum value is –4. The domain is all real numbers, R. The range is all real numbers less than or equal to –4, or {y|y ≤ –4}.
Check It Out!Example 3b Continued Check Graph f(x)=–2x2 – 4 on a graphing calculator. The graph and table support the answer.
Example 4: Agricultural Application The average height h in centimeters of a certain type of grain can be modeled by the function h(r) = 0.024r2 – 1.28r + 33.6, where r is the distance in centimeters between the rows in which the grain is planted. Based on this model, what is the minimum average height of the grain, and what is the row spacing that results in this height?
Example 4 Continued The minimum value will be at the vertex (r, h(r)). Step 1 Find the r-value of the vertex using a = 0.024 and b = –1.28.
Example 4 Continued Step 2 Substitute this r-value into h to find the corresponding minimum, h(r). h(r) = 0.024r2 – 1.28r + 33.6 Substitute 26.67 for r. h(26.67) = 0.024(26.67)2 – 1.28(26.67) + 33.6 h(26.67) ≈ 16.5 Use a calculator. The minimum height of the grain is about 16.5 cm planted at 26.7 cm apart.
Check Graph the function on a graphing calculator. Use the MINIMUM feature under the CALCULATE menu to approximate the minimum. The graph supports the answer.
Check It Out! Example 4 The highway mileage m in miles per gallon for a compact car is approximately by m(s) = –0.025s2 + 2.45s – 30, where s is the speed in miles per hour. What is the maximum mileage for this compact car to the nearest tenth of a mile per gallon? What speed results in this mileage?
( ) 2.45 b s = - 49 = - = ( ) 2 a 2 - 0.02 5 Check It Out! Example 4 Continued The maximum value will be at the vertex (s, m(s)). Step 1 Find the s-value of the vertex using a = –0.025 and b = 2.45.
Check It Out! Example 4 Continued Step 2 Substitute this s-value into m to find the corresponding maximum, m(s). m(s) = –0.025s2 + 2.45s – 30 Substitute 49 for r. m(49) = –0.025(49)2 + 2.45(49) – 30 m(49) ≈ 30 Use a calculator. The maximum mileage is 30 mi/gal at 49 mi/h.
Check It Out! Example 4 Continued Check Graph the function on a graphing calculator. Use the MAXIMUM feature under the CALCULATE menu to approximate the MAXIMUM. The graph supports the answer.
Lesson Quiz: Part I Consider the function f(x)= 2x2 + 6x – 7. 1. Determine whether the graph opens upward or downward. 2. Find the axis of symmetry. 3. Find the vertex. 4. Identify the maximum or minimum value of the function. 5. Find the y-intercept. upward x = –1.5 (–1.5, –11.5) min.: –11.5 –7
Lesson Quiz: Part II Consider the function f(x)= 2x2 + 6x – 7. 6. Graph the function. 7. Find the domain and range of the function. D: All real numbers;R {y|y≥ –11.5}