Major Sources
360 likes | 462 Vues
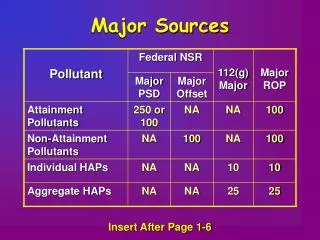
Major Sources. Insert After Page 1-6. PSD Applicability Matrix. I. III. No PSD But may be subject to minor source permitting. Modifications that by themselves exceed the Major Source threshold. II. IV.

Major Sources
E N D
Presentation Transcript
Major Sources Insert After Page 1-6
PSD Applicability Matrix I III No PSD But may be subject to minor source permitting Modifications that by themselves exceed the Major Source threshold II IV PSD for each pollutant emitted at greater than the Major Source threshold and each additional pollutant emitted at greater than its significant emissions threshold PSD for modifications that result in a significant emissions increase and a significant net emissions increase Insert After Page 2-4
PSD Applicability Matrix Applicability determination is based on the potential emissions increase resulting from the modification Applicability determination is based on the potential emissions increase resulting from the modification Applicability determination is based on the potential emissions from the new equipment Applicability determination is based on the potential emissions from the new equipment Applicability determination is based on the emissions increase above baseline actual emissions Applicability determination is based on the potential emissions from the new equipment Applicability determination is based on the potential emissions from the new equipment Insert After Page 2-4
Applicability New Facility Existing Facility 60 TPY VOC 60 TPY PM10 275 TPY PM10 Minor Source Minor Source + Major Source New Facility Existing Facility 350 TPY NOX 600 TPY CO 110 TPY CO Major Source Major Source + Sign. Source Insert After Page 2-4
PSD Applicability Matrix Quadrants III and IV – Existing Sources • We Must Decide: • If the proposed change is a modification • And • 2. What is the magnitude of the emissions increase from the modification Insert After Page 2-4
A more complete definition Any physical change in; Or change in the method of operation of; An existing major (Q4) source that; Would result in a significant emissions increase; and A significant net emissions increase. What’s a Modification? Excluding: • Routine maintenance, repair, and replacement; • Use of alternative fuels (under certain circumstances); • Changes of ownership; • The addition or replacement of a pollution control project; • Increases in operating hours or production rate, unless either are prohibited by permit condition Insert After Page 2-4
Quadrants I - III Potential Emissions Increases Potential emissions BEFORE the modification. Potential emissions AFTER the modification. Q3 Sources 498 TPY After - 249 TPY Before = 249 TPY Increase Q2 Sources 275 TPY After - 0 TPY Before = 275 TPY Increase Q1 Sources 249 TPY After - 0 TPY Before = 249 TPY Increase No PSD PSD No PSD Insert After Page 2-4
Actual to Potential Test The post-change POTENTIAL emissions are compared with the Baseline ACTUAL Emissions ACTUAL POTENTIAL Insert After Page 4-2
Company A submits an application to modify one of its boilers. Company A is an existing major stationary source (Q4) of NOX. The modification will increase potential NOX emissions from 75 lb/hr to 80 lb/hr. The boilers have consistently operated 7200 hr/yr, but are permitted to operate 8760 hr/yr (allowed 329 TPY). Using the Actual to Projected Actual Test, is this change subject to PSD? Example Baseline: 75 lb/hr x 7200 hr/yr x 1 ton/2000 lb = 270 TPY Potential: 80 lb/hr x 8760 hr/yr x 1 ton/2000 lb = 350 TPY Projected: 80 lb/hr x 7200 hr/yr x 1 ton/2000 lb = 288 TPY 350 - 270 = 80 TPY > 40 TPY Major 288 - 270 = 18 TPY < 40 TPY Minor Insert After Page 4-5
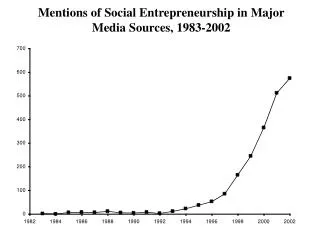
Example Instead of remaining constant, boiler utilization will continue its historical trend of 2% growth per year from 7200 hr/yr. What emissions could the boiler accommodate prior to the change? 75 lb/hr x Projected Utilization (hr/yr) Are these emissions independent of the change to 80 lb/hr? Would they have happened anyway? 344 337 331 324 318 323 316 312 310 74 306 304 300 298 294 292 288 287 281 270 270 275 270 Insert After Page 4-5 1 2 3 4 5 6 7 8 9 10
Question Since the boiler was already permitted at 329 TPY, why isn’t the level of excluded emissions equal to 329 TPY? Because, at the level of projected business activity, the boiler could only have accommodated 323 TPY of emissions, otherwise it would have violated its permit. 344 337 21 331 324 318 323 316 312 310 306 304 300 298 294 292 288 287 281 270 270 275 270 Insert After Page 4-5 1 2 3 4 5 6 7 8 9 10
Netting For modifications at existing major sources (Q4), there are two parts to PSD applicability… …determining if a significant emissions increase will occur …determining if a significant net emissions increase will occur Emissions change from the project Emissions change from the facility Insert After Page 3-6
In A Nutshell Each Emission Unit pays for admission only once… …as long as it complies with the terms of its admission The price of admission is installing BACT controls The terms of admission are the permit limits needed to ensure BACT Insert Before Page 5-1
What Are Qualifying Controls? Add-on control devices Pollution prevention activities Work practice standards A monetary investment in the controls is necessary! The investment must qualify as a capital expense under the IRS filing guidelines Insert Before Page 5-1
How Do I Get In On This? Use the Front Door…New EUs that install qualifying BACT controls through PSD automatically get in …Use the Back Door…EUs that installed qualifying BACT controls through PSD in past 10 years automatically get in … Or Climb in Through the WindowEUs with comparable, or “substantially as effective” control technology may get in (with a demonstration) Insert After Page 5-2
What Should I Expect? Permit limits specifying the start and end dates for the CU designation Monitoring, recordkeeping and reporting requirements adequate to allow on-going demonstration of compliance Emission limits based on, or equal to, BACT Permit limits on other terms such as operating parameters, on which the BACT and CU determinations were based Insert After Page 5-6
What to Expect The limit will be a rolling 12-month total – effective for 10 years Emissions from all sources of the PAL pollutant must be monitored, or a default value used Records must be kept for life of the PAL plus 5 years Annual compliance certification required Semi-annual deviation reports required Insert After Page 6-4
What to Expect The new PTI containing the PAL conditions must go through the public noticing requirements PAL conditions will be rolled into the ROP at its next opportunity Insert After Page 6-4
Can the PAL Level Be Changed? At Renewal Decreases Increases To correct typos or other errors To accommodate the generation of ERCs or Offsets To reflect the impact of new State or federal regulations To maintain air quality Ten steps to determine if an increase is allowable. Turn to Page 6-3 Appropriate level based on: Air Quality Needs Advances in Control Technology Anticipated Economic Growth in the Area To Reward or Encourage Voluntary Emission Reductions, etc… Insert After Page 6-3
How Do I Get Out of the PAL? Divide the PAL tonnage among all the emission units at the facility These allocations will become the new permit limits for each emission unit Insert After Page 6-4
Am I in?A PSD Applicability Summary… Insert After Page 7-7
Step 2: Eliminate TechnicallyInfeasible Options UNUSUAL CHARACTERISTICS Catalyst Blinding Agents Halogenated VOCs and Oxidizers Sticky PM and Baghouses Cool Exhaust Temperatures and SCR Insert After Page 8-2
Step 2: Eliminate TechnicallyInfeasible Options UNUSUAL CHARACTERISTICS Nobody Else In Our Industry Has Used It There’s Not Enough Room For The Ductwork The Roof Won’t Support It Consumes a Limited Natural Resource (Natural Gas) Will Require Its Own Electrical Substation Our Building Contains an Explosive Atmosphere REJECTED Insert After Page 8-2
Step 4: Evaluations Energy Impact Analysis Only Unusual Energy Impacts Should Be Considered These usually end up in the Economic Analysis Insert After Page 8-4
Step 4: Evaluations Environmental Impact Analysis This is not NAAQS and Increments Need to show unusual/unreasonable impacts compared to other facilities where this control option has been used Solid/Hazardous Waste Generation Visibility Impacts Water Discharges Insert After Page 8-4
Step 4: Evaluations Economic Impact Analysis How can control costs be determined so that they can be compared among different facilities and for different control options? Dollars per Ton of Pollutant Controlled Allows comparisons among different types of companies Allows comparisons among companies of different sizes Insert After Page 8-4
Step 4: Evaluations Economic Impact Analysis Dollars per Ton of Pollutant Controlled • Calculate the Annualized Cost for the control option • Calculate the Annual Emissions, in tons that will be reduced by the control option Insert After Page 8-5
Step 4: Evaluations Economic Impact Analysis Annualized Cost • Total Capital Investment annualized over 10 years at 7% interest • Annual Labor Costs (oper/maint/supv) • Annual Energy Costs (fuel/electrical) • Annual Overhead Costs (taxes/insurance) Insert After Page 8-5
Step 4: Evaluations Economic Impact Analysis Example Control Option No. 1 Control Option No. 2 Reduces 142 TPY (EU A & B) TCI = $4,500,000 10 years @ 7% = $635,400/yr Labor = $4000/yr Energy/Util = $123,000 Overhead = $75,400 Reduces 130 TPY (EU A only) TCI = $3,100,000 10 years @ 7% = $437,720/yr Labor = $4500/yr Energy/Util = $151,000 Overhead = $56,780 Control Cost = $837,800/yr $5900/ton for 142 tons Control Cost = $650,000/yr $5000/ton for 130 tons Assume Recent BACT determinations = $5000 - $6000/ton Insert After Page 8-5
Step 4: Evaluations Economic Impact Analysis Example Control Option No. 1 Control Option No. 2 Control Cost = $837,800/yr $5900/ton for 142 tons Control Cost = $650,000/yr $5000/ton for 130 tons Incremental Cost $837,800 - $650,000 = $187,800 142 tons – 130 tons = 12 tons $187,800 / 12 tons = $15,650/ton Assume Recent BACT determinations = $5000 - $6000/ton Insert After Page 8-5
Modeling WHO? - All PSD Applicants WHAT? – All New Emissions WHY? – To Show They Don’t Cause or Contribute to A Violation of Any NAAQS or PSD Increment Insert Before Page 9-17
Modeling for PSD Increments Only for SO2, NOX and PM10 Triggering Dates (See MDEQ Website) Increment Consuming Sources Increment Expanding Sources 80% Consumption Allowed Insert Before Page 9-17
Modeling for NAAQS • Emissions from All Sources having a significant impact • Measured Background • Source Inventories and Background Concentrations Available from MDEQ Insert Before Page 9-17
What Affects Modeling? Stack Height Building Height Terrain Height Exhaust Flow Rate (CFM) Exhaust Temperature Stack Exit Diameter Insert Before Page 9-1
Another View of Dispersion Insert Before Page 9-1
Building Downwash Insert Before Page 9-1