Download
1 / 23
230 likes | 390 Vues
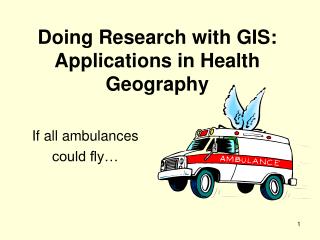
GIS and its applications in Health. دانشکده بهداشت دانشگاه علوم پزشکی تهران آذر ماه 1384 ارايه دهنده: عل ي اکبر حقدوست. Definition. Lilienfeld 1976 in “ Fundamental epidemiology ”

E N D
GIS and its applications in Health دانشکده بهداشت دانشگاه علوم پزشکی تهران آذر ماه 1384 ارايه دهنده: علي اکبر حقدوست
Definition • Lilienfeld 1976 in “Fundamental epidemiology” • Epidemiology: study of distribution of disease, or pathological condition in human populations and factors that influence this distribution • What does mean “distribution” in above definition? • We should explore the distribution in time and space • John Snow project
Poisson Distribution Assumptions: • Constant proportion in area • Independent distribution
Flying bombs strikes, south London • آيا بمبهاي آلمان در جنگ جهاني دوم آن گونه كه ادعا مي نمود قدرت تفكيك بالا در هدف قرار دادن مواضع را داشت؟
Flying bombs strikes, south London • Number of bombs in cells
Flying bombs strikes, south London • How can we test if the distribution of bombs was random?
Flying bombs strikes, south London • This method is robust even for small sample numbers • You can estimate variance even based on the group data • Limitation • It does not taking into account distances between events
Nearest neighbor method A a b c d • Minimum distance between observation I and (n-1) • Checks the distances between events
R r
Probability that a random point within the boundaries of the large circle falls within the boundaries of the small circle Probability that a random point within the boundaries of the large circle does not fall within the boundaries of the small circle Probability that n random points within the boundaries of the large circle does not fall within the boundaries of the small circle
Probability that at least one of n random points within the boundaries of the large circle falls within the boundaries of the small circle
Expected median, mean and variance based on these explanations (nearest neighbor analysis)
example آيا بين نقاط اين شكل هيچ ارتباطي وجود دارد؟
نقاط ضعف روش نزديكترين گزينه • Very large and small area (A) may reduce the significance
Transformed map • Uniform distribution is violated in nearly all situations. • Redraw a map so that the density of the individuals at risk is equalized over the area under study, called a cartogram
Limitations in using cartogram • We need to have an accurate map to illustrate the population density • The population at risk is not usually distributed exactly the same as the whole population • It needs power full computer to generate a cartogram
Alternative method • Case control approach • It means we can compare the spatial distribution of cases versus controls using Poisson models