Historical Trend and Comparable District Information
130 likes | 210 Vues
Explore historical trends in certificated staff salary and benefits in unified school districts, based on data from various sources like CDE and PUSD. The analysis includes total compensation components such as salary, health benefits, and class sizes. Gain insights into revenue sources and staffing trends in comparable districts for informed decision-making.

Historical Trend and Comparable District Information
E N D
Presentation Transcript
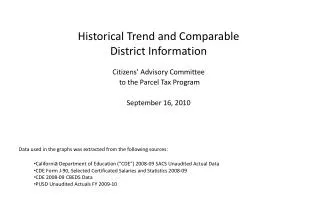
Historical Trend and Comparable District Information Citizens’Advisory Committee to the Parcel Tax Program September 16, 2010 • Data used in the graphs was extracted from the following sources: • California Department of Education (“CDE”) 2008-09 SACS Unaudited Actual Data • CDE Form J-90, Selected Certificated Salaries and Statistics 2008-09 • CDE 2008-09 CBEDS Data • PUSD Unaudited Actuals FY 2009-10
Revenue Sources per ADA Selected Comparable Districts FY 2008-2009 (A) Includes “pass through” revenue Albany, Castro Valley and Pleasanton receive on behalf of SELPA members in connection with Administrative Unit SELPA roles. Payments to the members are reflected as transfers out • Includes non-basic aid unified districts in the PUSD Standards and Criteria comparable group
Includes non-basic aid unified districts in the PUSD Standards and Criteria comparable group
Total compensation components: -- salary at BA + 75, step 15 (adjusted to constant 185 service days) -- 74% of PUSD certificated staff are in BA +75/MA + 60 column -- Average PUSD years of service is 15.2 -- Maximum district contribution health benefits (family coverage) Includes non-basic aid unified districts in the PUSD Standards and Criteria comparable group other than Berkeley (information not available)
Total compensation components: -- Maximum step/column (adjusted to constant 185 service days) -- Maximum district contribution health benefits (family coverage) Includes non-basic aid unified districts in the PUSD Standards and Criteria comparable group other than Berkeley (information not available)
Average Class Size Selected Comparable Districts FY 2008-2009 Includes non-basic aid unified districts in the PUSD Standards and Criteria comparable group