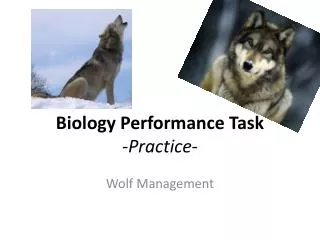
Performance Task In Biology
Performance Task In Biology. Design Lab: Investigation of Transpiration. Big Idea (in Biology) Structure and Function. Big Idea (in AP Biology) Biological systems interact and these interactions possess complex properties. Learning Objectives.

Performance Task In Biology
E N D
Presentation Transcript
Performance TaskIn Biology Design Lab: Investigation of Transpiration
Big Idea (in Biology) Structure and Function Big Idea (in AP Biology) Biological systems interact and these interactions possess complex properties
Learning Objectives Students may observe a relationship between environment and rate of transpiration. Students may observe a relationship between the rate of transpiration and the number of stomata on the leaves. Students may observe that different plants have different rates of transpiration. Students will write a scientific technical paper inclusive with abstract, procedure, raw data, processed data, graphs, analysis, and conclusion of their experiment. Students will share data and collaborate within their group and within the classroom of scientific groups. Students will present their findings to the class as a whole class discussion so class can compare experiments. Students can apply the knowledge learned from their experimentation to successfully grow their own plants at home.
Essential Questions Is there a relationship between the rate of transpiration and the number of stomata? Does the amount of humidity in the environment determine the rate of transpiration? Is there a relationship between evaporation and transpirational pull? Do all plants transpire at the same rate? Is there a relationship between soil and the rate of transpiration?
Prior Knowledge Water is used by plants during photosynthesis to replace the electrons lost in photosystem II to the electron transport chain. Water moves from one cell to the next by osmosis. Differences in water potential drives water transport in plant cells. Water has physical properties; cohesion, adhesion, and capillarity which aid in the movement of xylem sap through the stem. Plants’ roots absorb water and mineral salts eventually moving into the stem which has negative pressure created by transpirational pull due to evaporation of xylem sap through stomata found on the underside of leaves. Guard cells control the opening and closing of stomata. Plants fix carbon through different pathways which is dependent upon their need to conserve water. Different environments have varying temperatures, humidity, amount of sunlight, and amount of precipitation which can determine how a plant will thrive. Use of scientific apparatus; rulers, scales, beakers, graduated cylinders, and other equipment they feel they need for their experimental design.
The Task Students form scientific groups No more than four per group Collaboratively design an experiment that will investigate plant transpiration answering one or several of the essential questions. There will be 7 days designated for this task. Thursday to the following Friday. Day one in classroom for collaboration and design, day two for material collection within classroom and the weekend to purchase plants. Monday will begin the experiment and Friday will be the last data collection day. Monday will be a full class period to set up experiment and collect baseline data. The experiment must have quantitative data and will be observed during the first 30 minutes of class for the next 4 consecutive days. Students will be using metric rulers, metric scales, digital scales, and graduated glassware. Summative Assessment and Presentation are a week after experimentation.
Educative Assessment Feedback is given on a daily basis as students need help, inquire, or ask questions. Teacher will provide scaffolding information but will not instruct; only provide additional questions which students can answer to solve their own questions. Day 1: Individual group discussions will take place to assess experimental design and measureable experimental objectives. Scaffold to proper design if necessary. A copy of procedures will be handed in for proofing (determining group is staying on task throughout the experiment). Day 2: List of materials will be discussed and retrieved from workroom and plant requests will be discussed for purchasing; type and amounts. Day 3: Teacher will only be available for student lead questioning, teacher will only answer back with scaffolding questioning so students can acquire their own answers. Day 4: Teacher only makes sure correct use of scales, reminding students for calibration of scales, and measurements are in appropriate units. Day 5-7: Teacher only available if students have questions. Observe students are following their procedures as they have written them.
Possible Exemplar Experiment • Independent Variable: Use of 4 different environments; hot like the desert, dry like the chaparral, humid like the rainforest, and the control (in this case room temperature/ with dehumidifier) Gro-lights will be placed in all environments for ultraviolet radiation. • Dependent Variable: Mass of each plant measured each day. • 4-8 C3 plants of one type in each environment, similar height, similar leaf and flower number. • Same soil • Watered the same amount prior to experimentation, soil allowed to drain. Plants are not watered again until after experimentation is complete. • Plants pulled out of container and placed in bag up to stem/soil interface and closed with tie. The plastic bag now becomes the planter and protects the soil from water evaporation. • Average area of leaves measured (area of an oval) • Approximate number of stomata/plant (count stomata of 1 leaf of each size if there are multiple sizes) and multiply the number of stomata by leaves (for each size) and add the sum of stomata of each leaf size for each plant.
Exemplar Design Explained • In the experiment, the mass of the plant will change as the water evaporates out of the stomata, this is called transpiration. Although, there are three types of transpiration, students at this level will not have prior knowledge of this. They may have researched it and perhaps designed an experiment to measure it, but this experiment concentrates on the stomatal transpiration. • The mass of the plants is directly proportional to the water loss because the plants are not watered throughout the experiment. As the plants utilize the water through the uptake from the soil, the mass of the plant gets smaller. By observation throughout the experiment the plant leaves begin to wilt and the overall health of the plant begins to decline in the desert and chaparral as the water vapor is quickly evaporated away from the leaves. Mass is lost in the control but health of plant usually is fine. The loss of plant mass is the least in the rainforest environment because the air is very moist and humid retaining water vapor so not much is lost from the plant to the air because transpiration occurs more slowly. • The direct link between amount of stomata and rate of transpiration is not measured in this experiment but is a good quantitative measure of the leaf organ and can be used to compare this study with another experimental design within the class that may have different stomata numbers that used the same experimental design.
Summative Assessment Scientific Technical Paper Abstract (introduction to include some research) Purpose Independent Variable Dependent Variable Materials list Procedure Raw Data Table Processed Data (calculations if used) Appropriate Graph Analysis Conclusion Bibliography
Rubric for Scientific Report 50 pt scale Turns in only raw data table. Turns in raw data table with graph. Turns in Three sentence abstract, raw data table, and three sentence conclusion or some component of understanding the experimental outcome. Turns in paragraph abstract, purpose, raw data table, paragraph of outcome but not clear linking between transpiration and outcome. Half page abstract, purpose, raw data table, graph, paragraph of outcome. Half page abstract, purpose, variables, raw data table, graph, more than a paragraph of outcome. Same as 10, but missing procedure and materials list. Same as 10, but missing one minor component like procedure, materials list, analysis. Same as 10, but missing small component like Bibliography or calculations. Basic list of requirement inclusive of a full page abstract with research information including citation, clear understanding of dependent and independent variables, analysis uses supportive quantitative measures from graphs, conclusion is two to three paragraphs and includes explanation of experimental error possibilities and how future experiments could be changed.
Explanation for Scientific Report Rubric • The Rubric is subjective and is just an example. The example used is referenced from the most popular type of reports handed in by my AP students. • At the level of AP Biology, students must have rigorous assessment. • The formal report is not just an assessment for a grade, but it guides the students to sequence their own learning during experimentation when they reflect on what they have completed in the laboratory. The lab is not just for a fun time, but for building skills. • The report builds their critical thinking skills, ability to inference from their data, analyze and critique areas of experimental design, justify their conclusion supported by their results and improve writing skills. • Written feedback is given to every student whether changes are needed or the report is well written.
Group Presentation: Model of Exemplar Experimental Designs • Each group will present their experimental design and results a week after the experiment. This allows them to write their scientific paper and draw some conclusions for presentation. • Raw data table will be placed on the board in case other groups want to use it in their Extra Credit Report for a comparison. • The group will explain their results and what they believe is the possible reason for their outcome. • Question and answer session will be allowed for scientific discussion between groups.
Extra Credit Report: Revision • Students will be given a change to modify their first scientific report grade. At this point they will not know the grade, but will know according to the rubric what they are lacking when they turned in the paper. • The presentation is used for peer feedback to the group as well as a second look at the experimental data. Perhaps there is another conclusion that can be drawn since other groups had the same design but different plants, number of stomata varied and can draw additional conclusions. • Perhaps new insights to transpiration and rate of transpiration can be gathered when listening to all the data from all the groups. Writing a collection of possible conclusions can be written. • This report can be used to help students further their understanding of the concepts during the lab experience. • The nature of science includes collaboration of scientists and peer review. This part of lesson component is an additional real world science experience in the classroom.
Understandings • Water from the soil eventually is evaporated into the atmosphere through transpiration by plants. • If all possible design labs are created, then students will understand there is a relationship between plant variety, stomata number, and environment. • Increase number of stomata increases rate of transpiration as long as it has the same carbon fixation. • Desert and chaparral environments have a greater rate of transpiration than the rainforest. • In the same environment, different plant varieties have different rates of transpiration.
Self-Assessment and Reflection • Students will have rubrics to assist them in task completion . • Students encouraged to double check their procedure to ensure they have completed their design completely. • Students need to make sure their design is being measured with the same apparatus and in a consistent manner. • Teacher uses scaffolding questions after Day 7 data collection to help students Reflect: • Is there a pattern that can be seen in the raw data table? • Does the pattern have any outliers? Why do you think they appear? Were there any errors during quantitative measures? • Which type of graph would be most appropriate to display your data: line, bar, or circle graph? Will the graph have readability? • Is one graph enough, or should you use multiple graphs? • How would you display multiple variety of plants’ mass change over time? • Did you have only one variable that you tested? If not, how will you distinguish which changed the transpiration rate?
Task Completion • Students turn in extra credit report for revision and improve their grade. • Students have informal share time of their comparative conclusions between groups. • Class discussion for review of transpiration and fluid transport in plants.
Summary • New curriculum requires AP Biology students to have student design labs with certain criteria met for 8 labs. • Teachers can only scaffold students in the right direction after there has been ample direct instruction of content. • This lab was a cookie cutter lab redesigned for this class to help guide me towards total student inquiry. • The Presentations and Extra Credit Report were added as a result trying to add greater student application of understanding, global scientific perspective, and reflection of self-knowledge; facets 3, 4, and 6.