Download
1 / 13
130 likes | 230 Vues
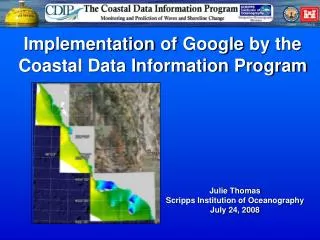
Explore the Coastal Data Information Program (CDIP) implemented by Scripps Institution of Oceanography to monitor and predict nearshore waves and shoreline change using Google Maps technology. CDIP stations track wave amplitudes, provide wave inundation predictions, and display wave models overlay on Google Earth for Southern California. Real-time GPS tracking of buoys and in-situ survey data coverage enhance coastal monitoring efforts.

E N D
ImplementationofGoogleby the Coastal Data Information Program Julie Thomas Scripps Institution of Oceanography July 24, 2008
COASTALDATAINFORMATIONPROGRAM • Based at SIO since 1975 • 35 Wave Stations • 14 People • $2.5M+ / year budget • Funded by: CDBW USACE (SCCOOS BEACON ONR…) CDIP Mission: Monitor and predict nearshore waves and shoreline change.
Map of all CDIP stations • Uses GeoRSS file • AJAX timeout request updates map automatically every 10 min. • Diameter of icon depicts • wave amplitude http://cdip.ucsd.edu
Wave Inundation Predictions 3-day forecasts • Basic map of Wave • Inundation locations • Information window with summary and link
Google Map serves as tool for CDIP operations GPS Tracking via Iridium Satellite communications • Able to track realtime • positions of CDIP • buoys with respect • to their deployment • positions Chesapeake Bay GPS drift trail of buoy which was struck by a vessel. July 10, 2008
Northern CA Nowcast Wave Models Display wave model images via KML file Southern CA Central CA
CDIP Wave Nowcast Models – Google Earth overlay Display swell model images in Google Earth via KML files
Southern California Coastal Ocean Observing System Multi-layer overlay of NOAA Raster chart, wave data and surface currents. Wave Model Surface Currents http://www.sccoos.org/data/harbors/lalb/fullscreen.php
Model and Prediction (MOP) Overview • 10,000 MOP locations for all of California • Drag/Zoom AJAX request refreshes image overlay generated on-the-fly • Center of map exactly selects stake
In-Situ Survey Data Coverage http://cdip.ucsd.edu • Small overview map • showing bounds of • survey • All survey pages have • this map to anchor • user • Image overlay of data • on map • Ability to recreate data • image overlay of data • on-the-fly for more detail • on POST request
Coastal Photo Gallery • Drag/Zoom map to display • sets of photos that are part • of the map bounds • AJAX requests update photo • set below
Light Detection and Ranging (LIDAR) LIDAR data overlay as KML file in Google Earth USA Mexico Tijuana Bull Ring
LIDAR Data Coverage • 10m contour lines displayed via GPolyline • LIDAR coverage dsplayed via GPolygon