A . A3_6p (a) PBMC
110 likes | 259 Vues
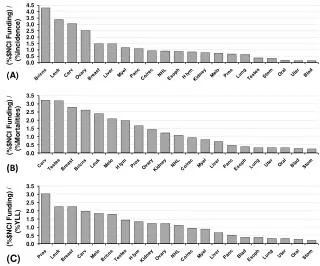
A. B. C. D. Figure S1 Comparison of genotype concordance of LCLs among SNP based on the chromosomal location. A total of 16 LCL strains at different propagation stages were compared for genotype concordance. A.

A . A3_6p (a) PBMC
E N D
Presentation Transcript
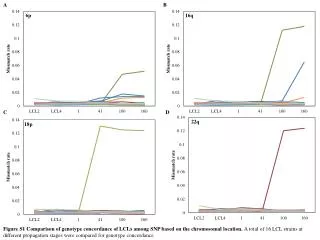
A B C D Figure S1 Comparison of genotype concordance of LCLs among SNP based on the chromosomal location. A total of 16 LCL strains at different propagation stages were compared for genotype concordance
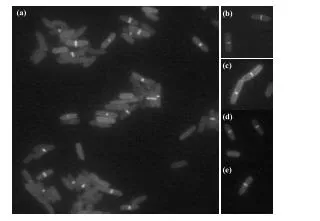
A Figure S2. The loss of heterozygosity (LOH) observed in (A) chromosome 6p in A3 strain, (B) 16q in A3, (C) 16q in A10, (D) 18p in K3 and (E) 22q in A2. A black bar indicates each variant with a mismatch.
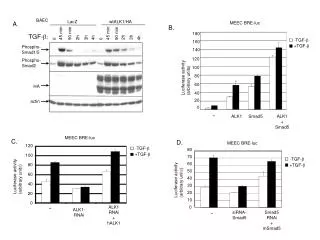
A . A3_6p (a) PBMC (b) LCL 100 (b) LCL 160 Figure S3. The loss of heterozygocity (LOH) identified at different chromosomal regions by Log R ratio and B allele frequency analyses.
B. A3_16q (a) PBMC (b) LCL 100 (c) LCL 160
C. A10_16q (a) PBMC (b) LCL 160
D. K3_18p (a) PBMC (b) LCL 41 (b) LCL 100 (b) LCL 160
E. A2_22q (a) PBMC (b) LCL 100 (c) LCL 160