Download
1 / 16
180 likes | 463 Vues
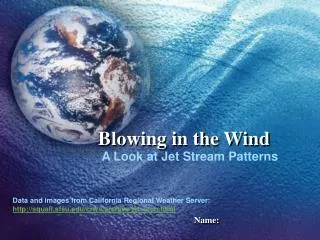
Blowing in the Wind. A Look at Jet Stream Patterns. Name:. January 2004. Average Speed 127 mph. Data and images from California Regional Weather Server: http://squall.sfsu.edu/crws/archive/jet_arch.html. February 2004. Average Speed 118 mph.

E N D
Blowing in the Wind A Look at Jet Stream Patterns Name:
January 2004 Average Speed 127 mph Data and images from California Regional Weather Server: http://squall.sfsu.edu/crws/archive/jet_arch.html
February 2004 Average Speed 118 mph Data and images from California Regional Weather Server: http://squall.sfsu.edu/crws/archive/jet_arch.html
March 2004 Average Speed 113 mph Data and images from California Regional Weather Server: http://squall.sfsu.edu/crws/archive/jet_arch.html
April 2004 Average Speed 82 mph Data and images from California Regional Weather Server: http://squall.sfsu.edu/crws/archive/jet_arch.html
May 2004 Average Speed 65 mph Data and images from California Regional Weather Server: http://squall.sfsu.edu/crws/archive/jet_arch.html
June 2004 Average Speed 57 mph Data and images from California Regional Weather Server: http://squall.sfsu.edu/crws/archive/jet_arch.html
July 2004 Average Speed 45 mph Data and images from California Regional Weather Server: http://squall.sfsu.edu/crws/archive/jet_arch.html
August 2004 Average Speed 44 mph Data and images from California Regional Weather Server: http://squall.sfsu.edu/crws/archive/jet_arch.html
September 2004 Average Speed 62 mph Data and images from California Regional Weather Server: http://squall.sfsu.edu/crws/archive/jet_arch.html
October 2004 Average Speed 79 mph Data and images from California Regional Weather Server: http://squall.sfsu.edu/crws/archive/jet_arch.html
November 2004 Average Speed 105 mph Data and images from California Regional Weather Server: http://squall.sfsu.edu/crws/archive/jet_arch.html
December 2004 Average Speed 121 mph Data and images from California Regional Weather Server: http://squall.sfsu.edu/crws/archive/jet_arch.html
Make a Chart! • Open the Excel spreadsheet and place the months and average monthly wind speed in the boxes. • Highlight the boxes with the months and numbers, and click “Insert/Chart.” • Choose the type of chart you want, and click “Next” two times. • Label your “x axis” “Months” and your “value z” axis “MPH.” • Click “As Object In,” and click “Finish.” • Congratulations!! Move your chart down to where you see the word “Chart,” then answer the questions on the next page!
Do You See a Pattern? • 1. During which months is the jet stream located closest to the North Pole? Closest to the equator? • Closest to North Pole: • Closest to Equator: • 2. During which months does the jet stream have the highest wind speeds? The lowest? • Highest: • Lowest: • 3. What pattern of change do you see during the year? • Answer: