
Uploaded by
kaz
1 SLIDES
190 VUES
10LIKES
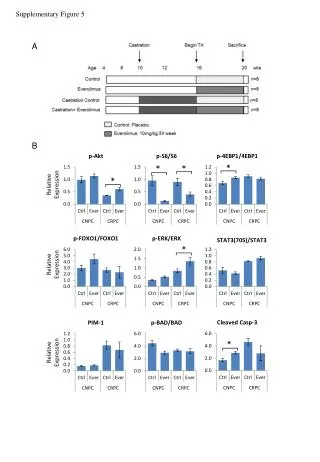
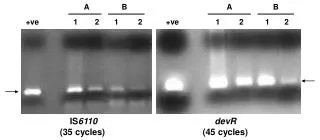
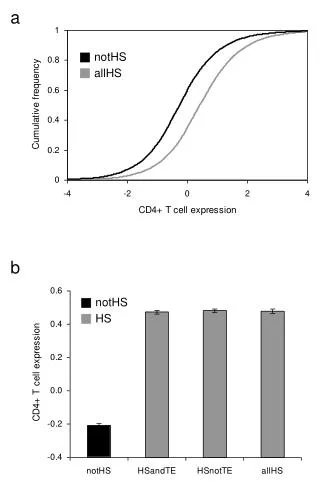
Relative Expression Analysis in Supplementary Figure 5
DESCRIPTION
Supplementary Figure 5 illustrates the relative expression levels of targeted genes across various conditions. Detailed comparisons highlight variations under specific treatments, showing significant changes in gene expression patterns. This analysis provides insights into the molecular mechanisms driving the observed phenotypic outcomes and supports the overall findings of the study. Data visualization enables researchers to discern the underlying trends and correlations pertinent to gene behavior in response to experimental stimuli.
Download
1 / 1
Télécharger la présentation 
Relative Expression Analysis in Supplementary Figure 5
An Image/Link below is provided (as is) to download presentation
Download Policy: Content on the Website is provided to you AS IS for your information and personal use and may not be sold / licensed / shared on other websites without getting consent from its author.
Content is provided to you AS IS for your information and personal use only.
Download presentation by click this link.
While downloading, if for some reason you are not able to download a presentation, the publisher may have deleted the file from their server.
During download, if you can't get a presentation, the file might be deleted by the publisher.
E N D
Presentation Transcript
Supplementary Figure 5 A B * * * Relative Expression * * Relative Expression * Relative Expression

More Related